Home Templates Visual Work & documents Infographics and Data Storytelling Infographics and Data Storytelling Stat blocks, timelines, funnels, process flows, and org charts drawn with real line and arrow primitives.
Work & documents · 20 editable templates
Start with one editable example. Choose another design in the card to preview it; every template keeps its own details and Studio editor.
Infographics And Data Storytelling
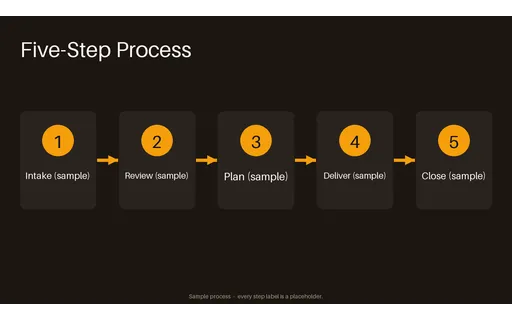
Five-Step Process Flow: a deterministic Novus visual template in Infographics and Data Storytelling, built on the flow-diagram layout family. Editable slots: flow title; five step labels; arrow accent colour; footer note
File PNG/WEBP · 120.4 KB Choose a variant (20)Five-Step Process Flow · PNG/WEBP Conversion Funnel Stages · PNG/WEBP Product Launch Timeline · PNG/WEBP Team Structure Chart · PNG/WEBP Customer Journey Map · PNG/WEBP Onboarding Journey Flow · PNG/WEBP Annual Impact Figures · PNG/WEBP Quarterly Metric Tiles · PNG/WEBP Survey Results Tiles · PNG/WEBP Community Reach Tiles · PNG/WEBP Data Story Poster · PNG/WEBP Figures At A Glance · PNG/WEBP Survey Response Chart · WEBP Year in Review Timeline · PNG/WEBP Method Flow Panel · PNG/WEBP Headline Figure Stats · PNG/WEBP Data Source Sheet · PNG/WEBP Chart Honesty Checklist · PNG/WEBP Finding Quote Card · PNG/WEBP Monthly Series Calendar · PNG/WEBP