Observability
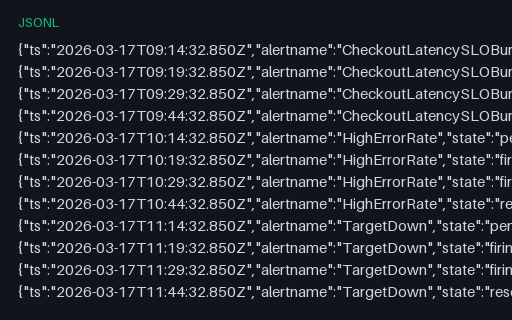
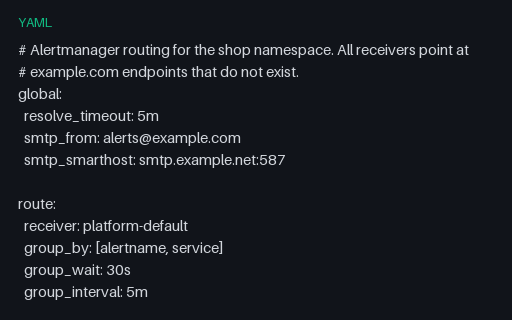
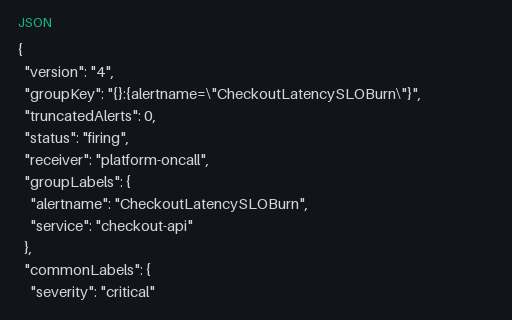
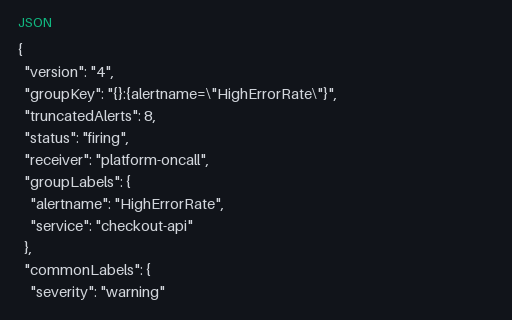
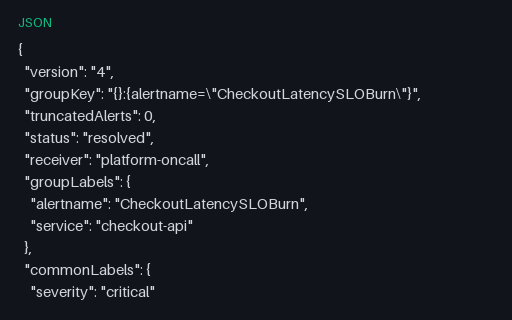
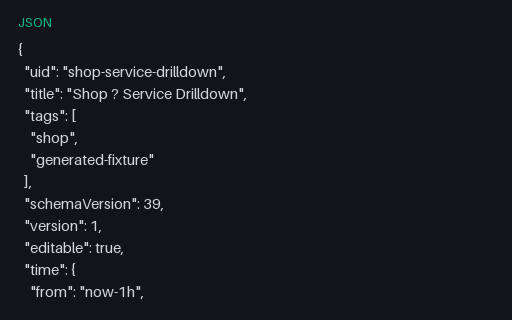
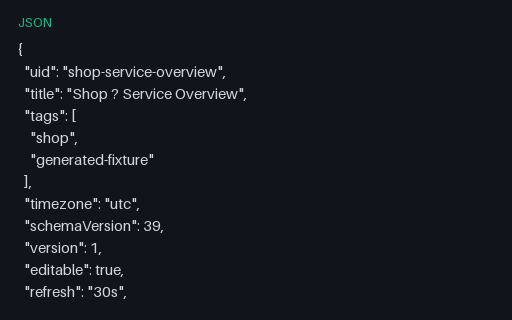
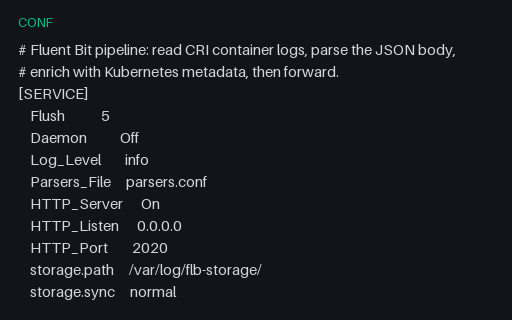
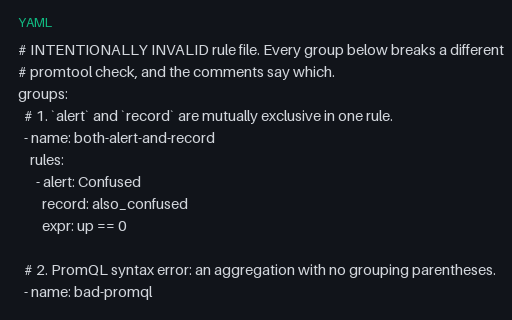
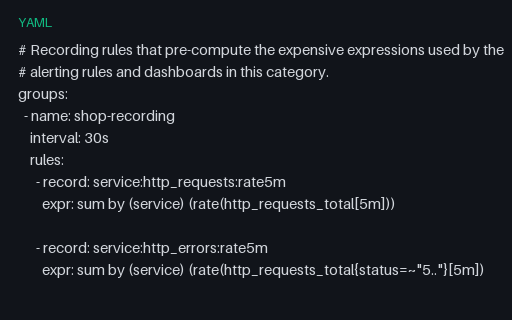
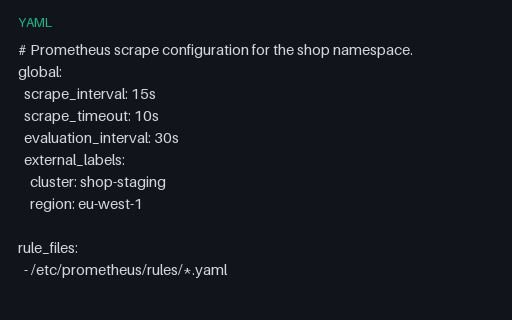
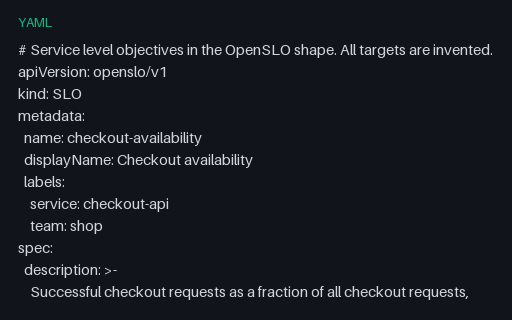
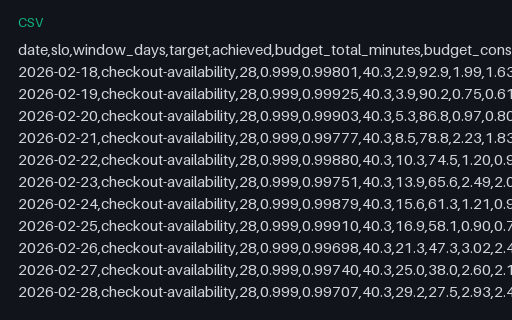
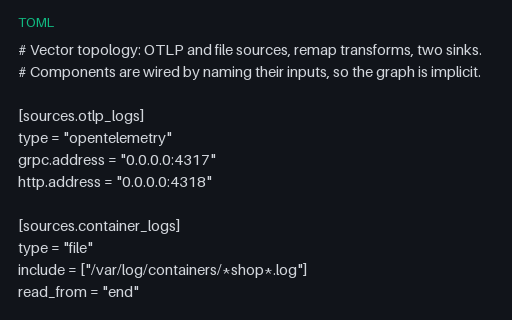
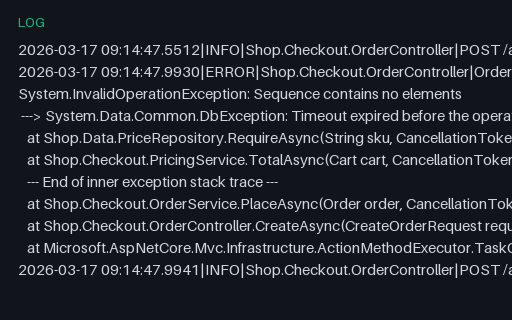
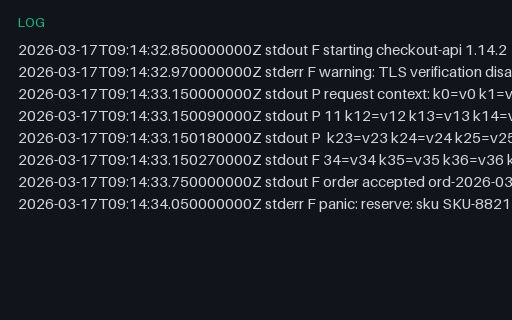
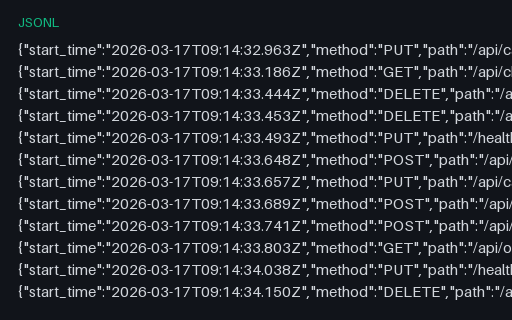
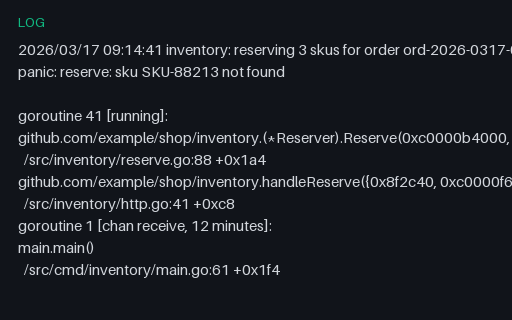
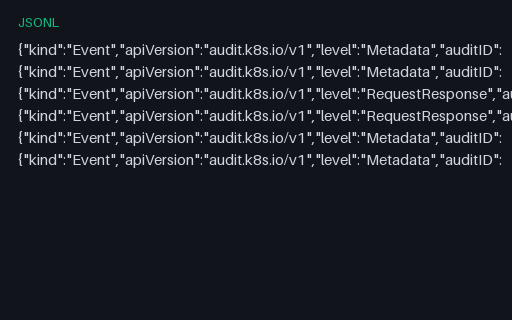
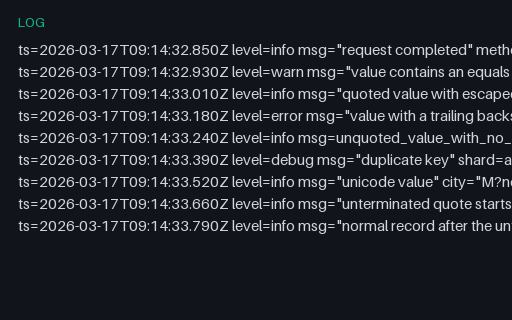
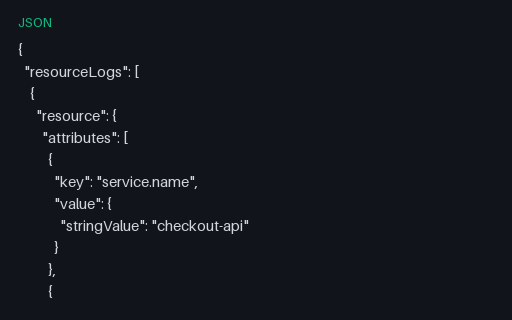
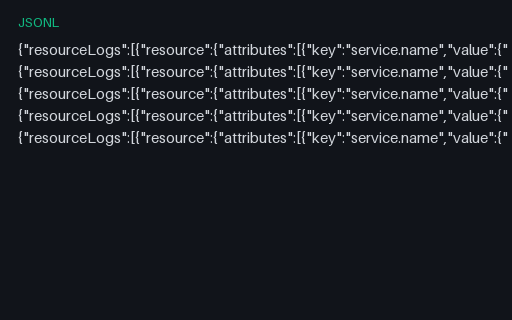
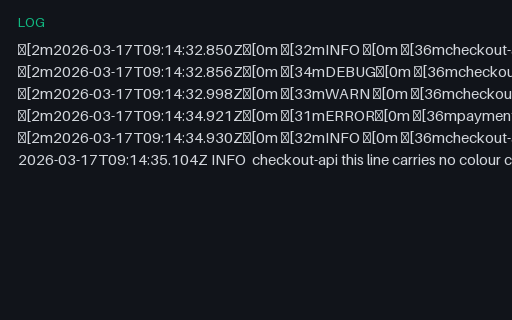
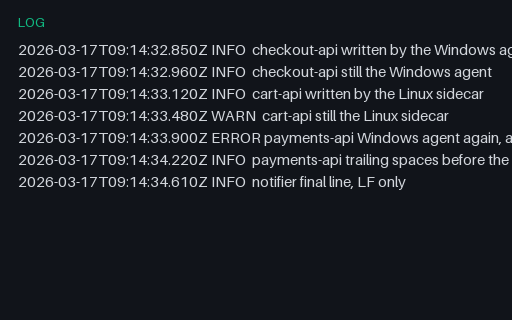
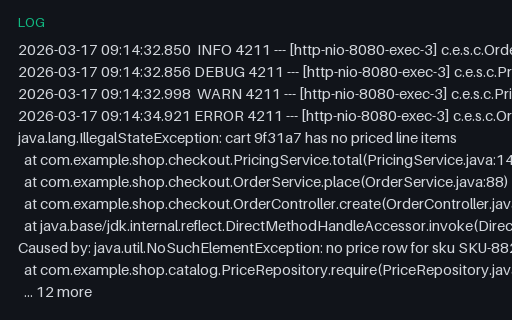
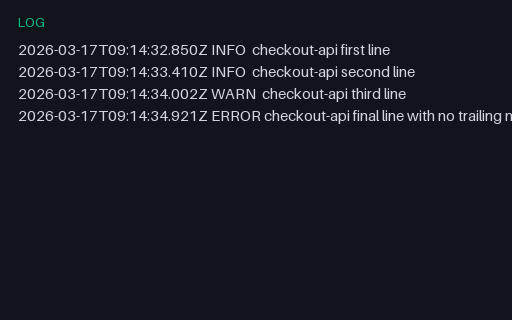
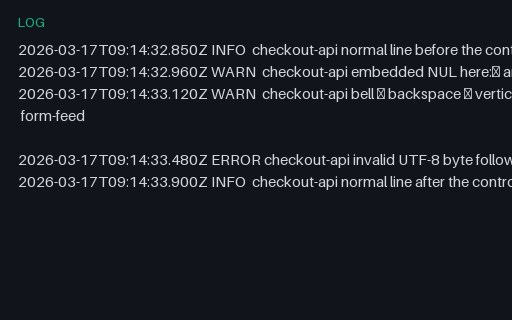
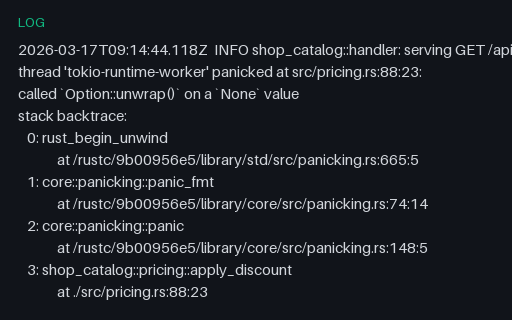
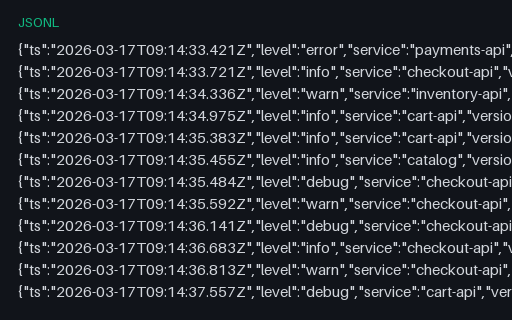
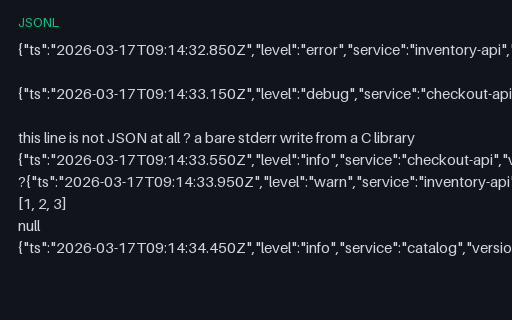
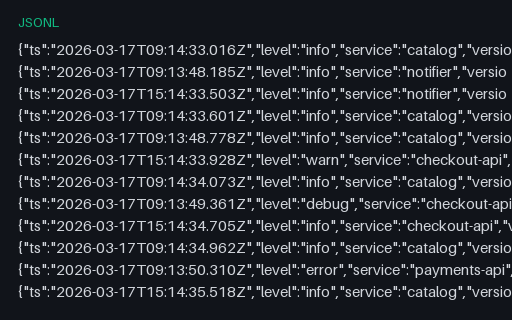
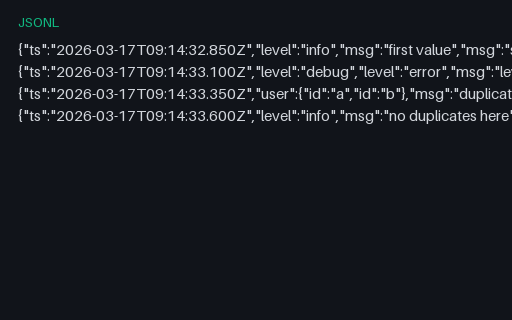
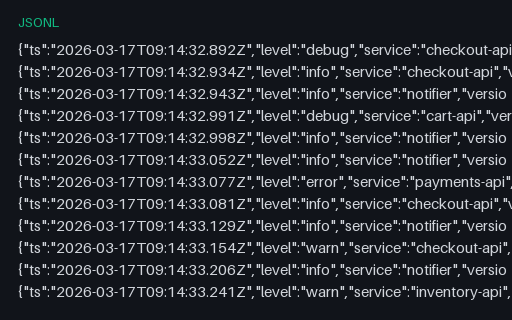
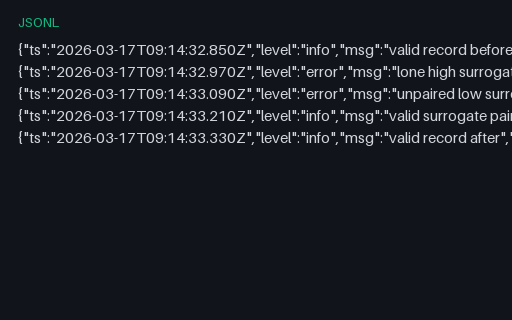
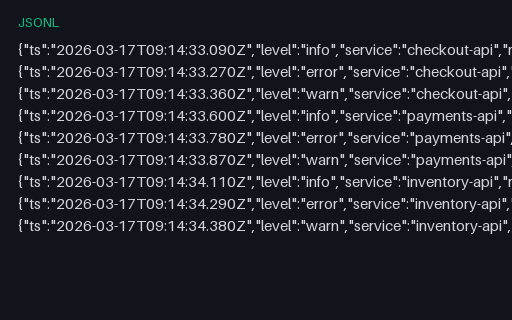
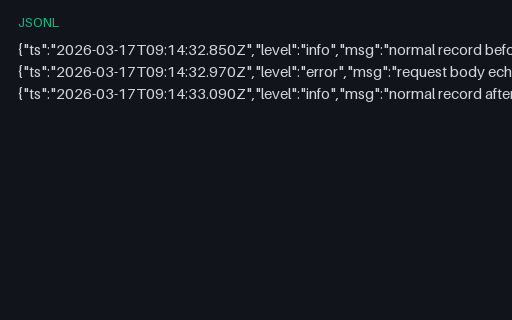
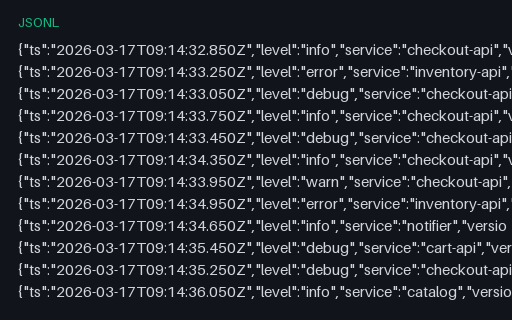
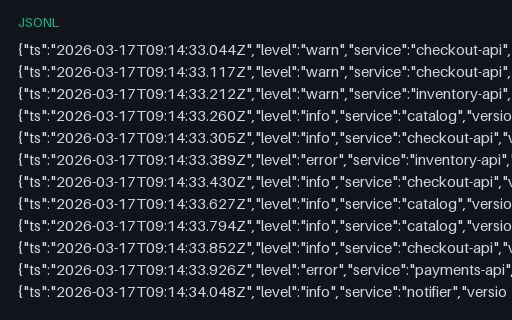
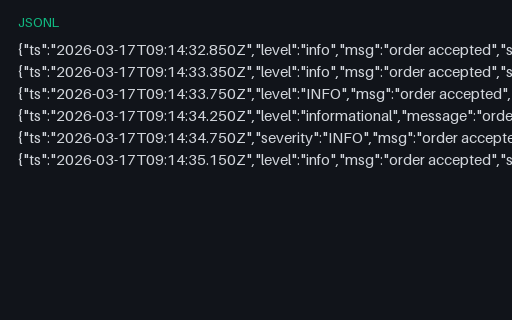
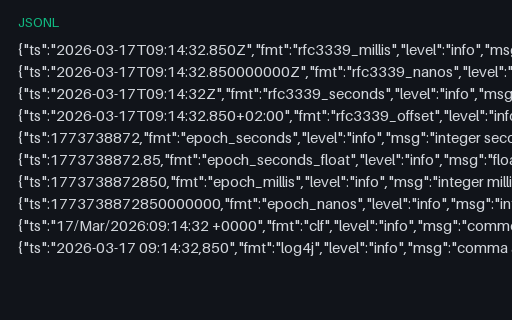
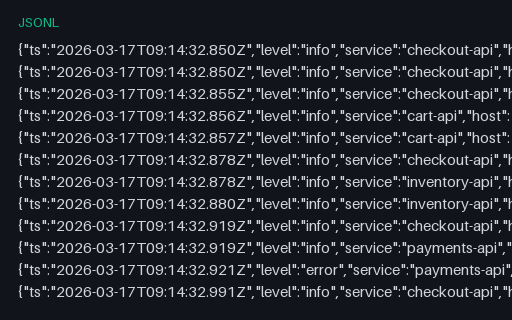
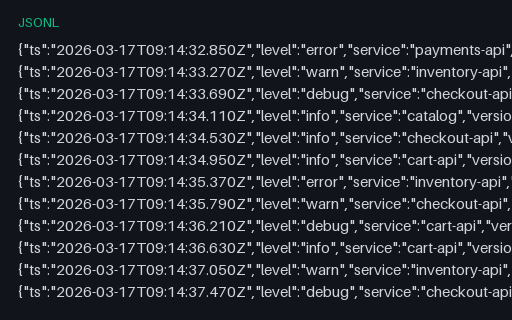
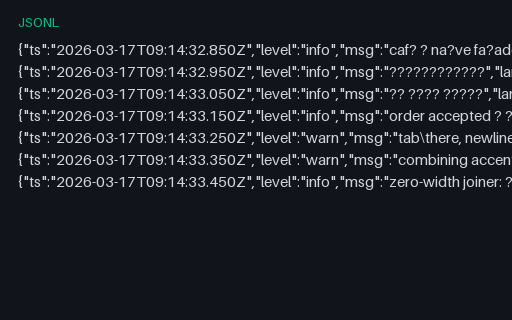
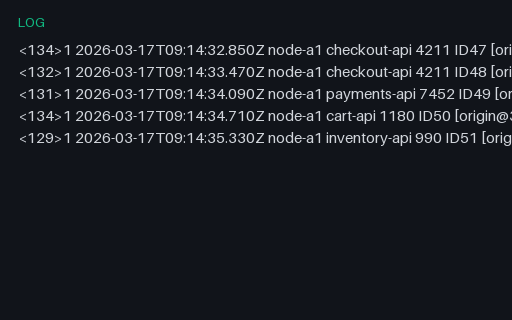
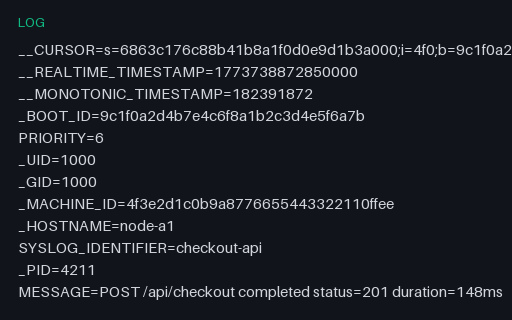
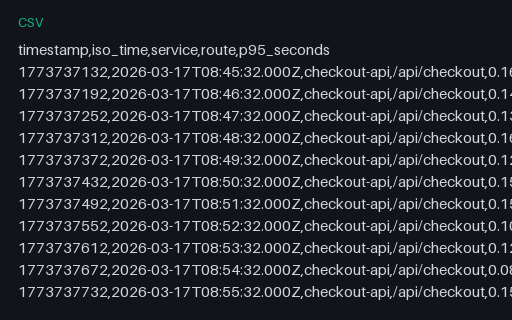
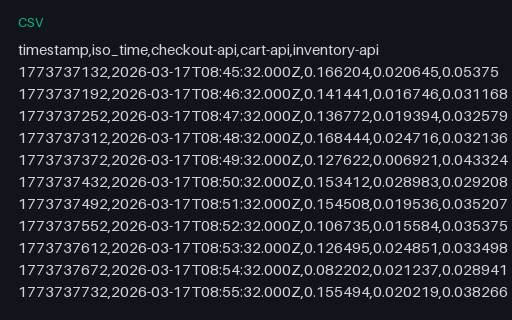
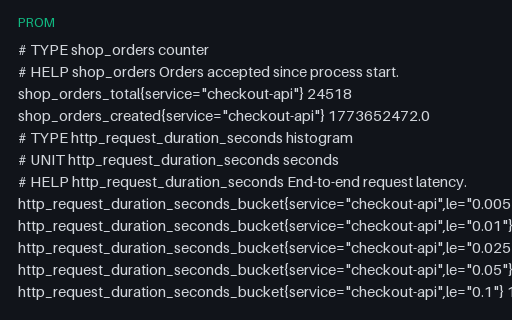
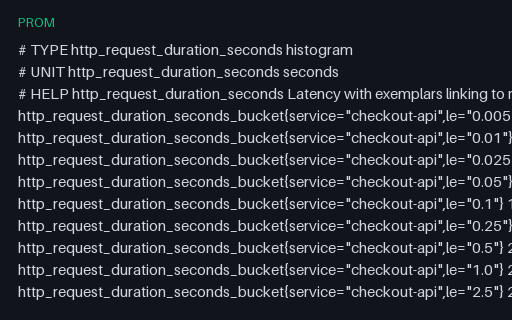
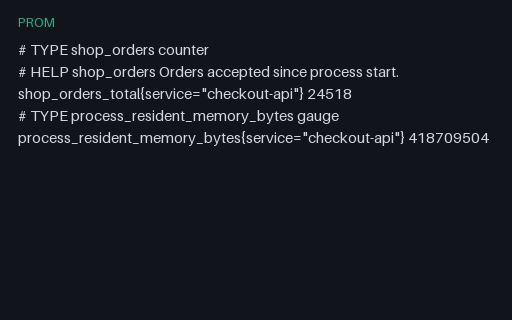
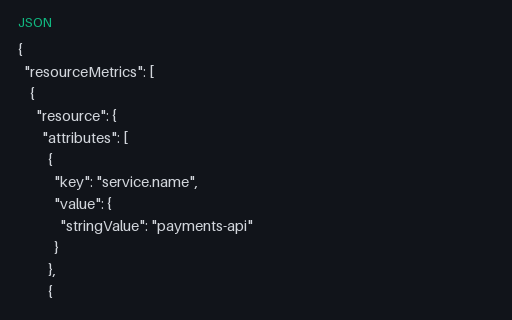
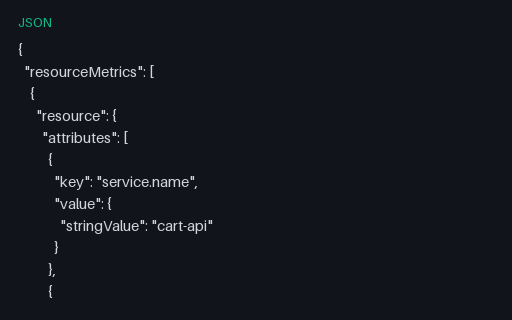
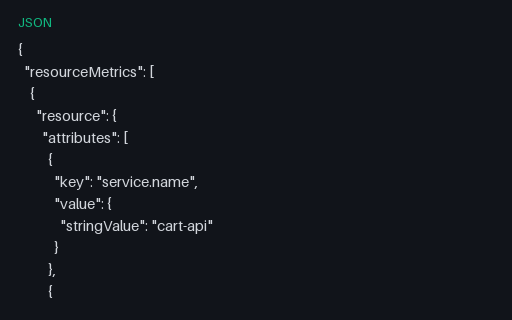
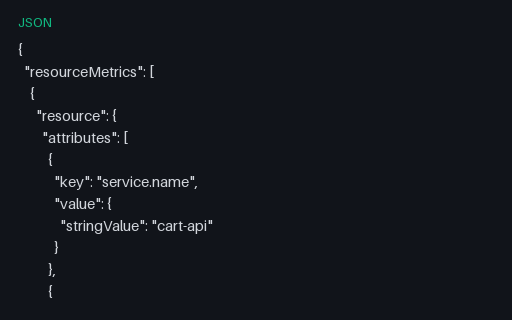
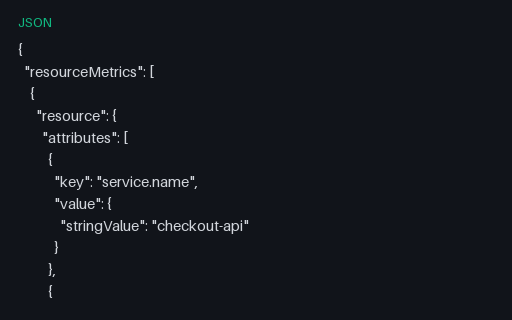
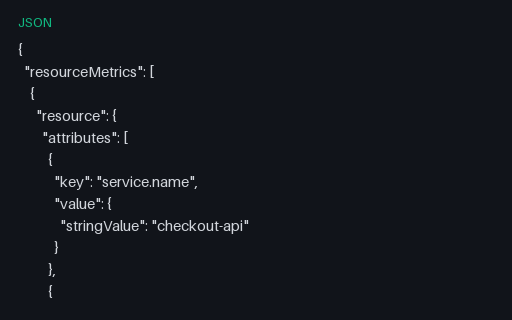
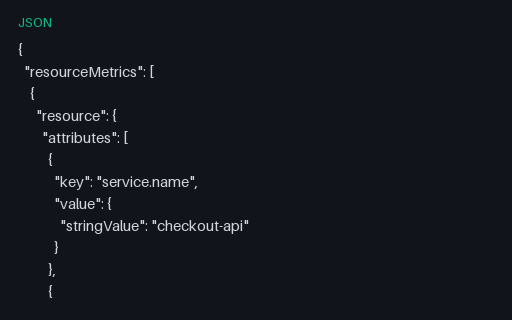
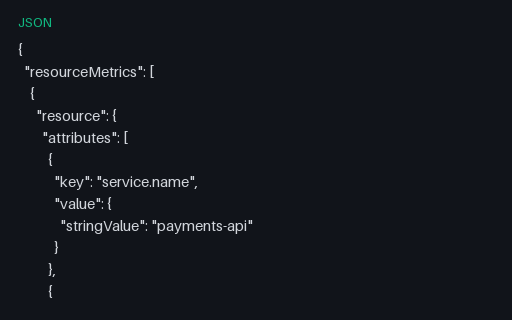
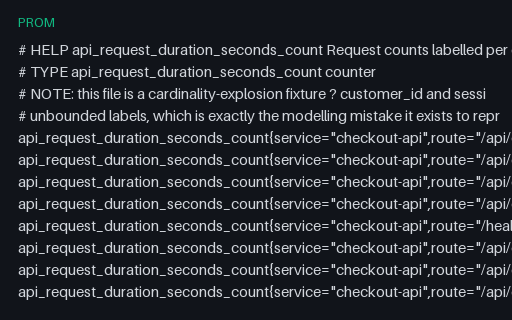
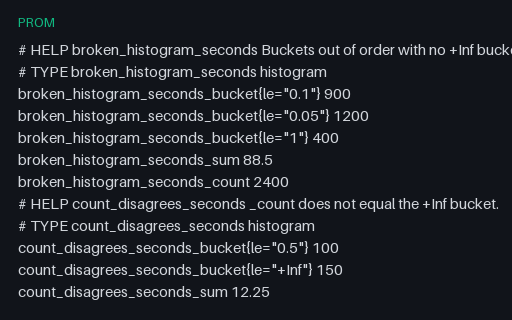
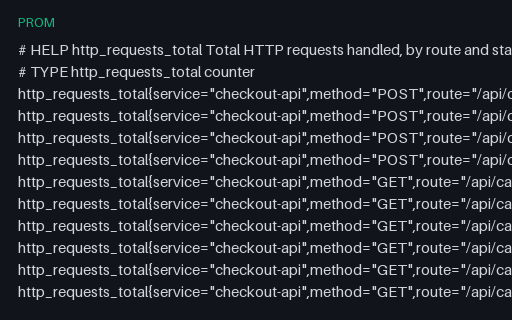
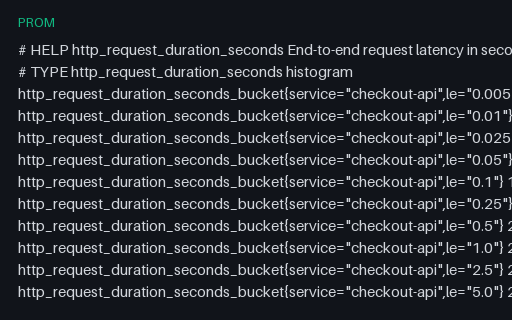
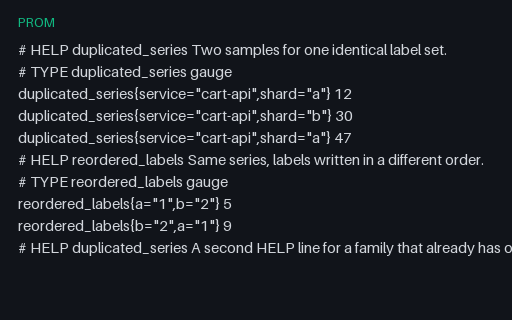
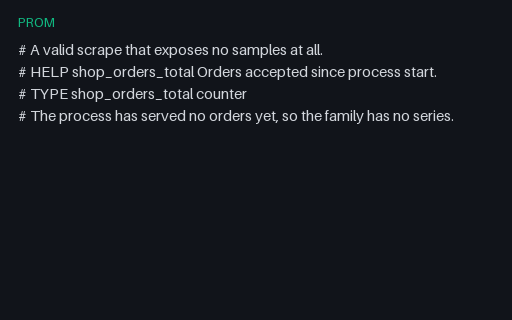
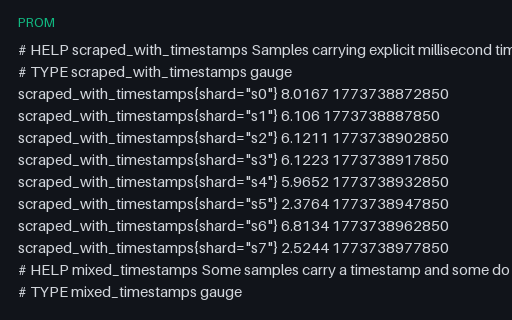
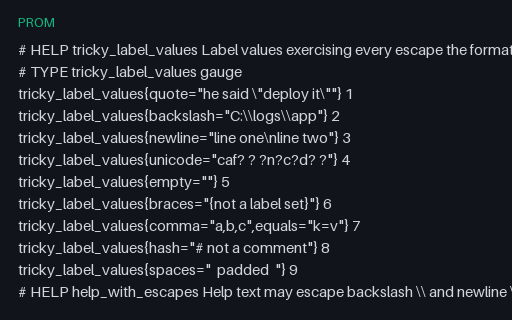
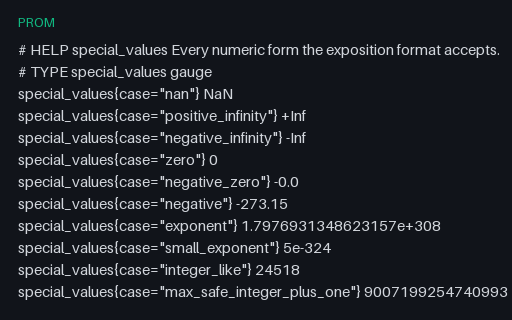
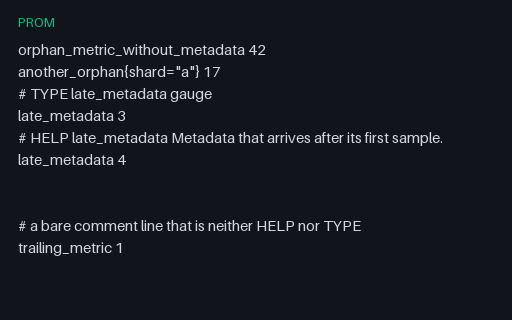
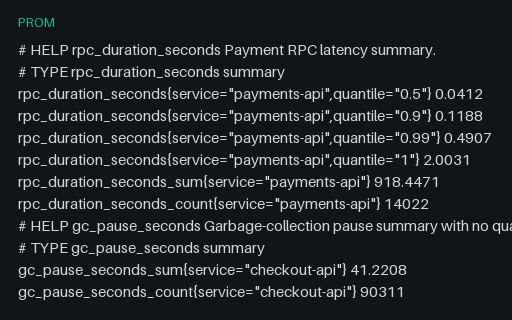
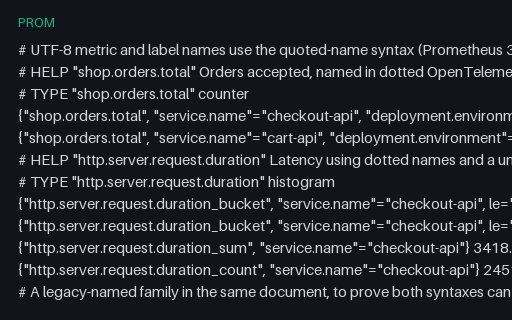
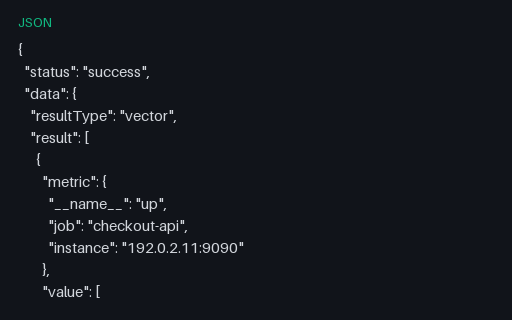
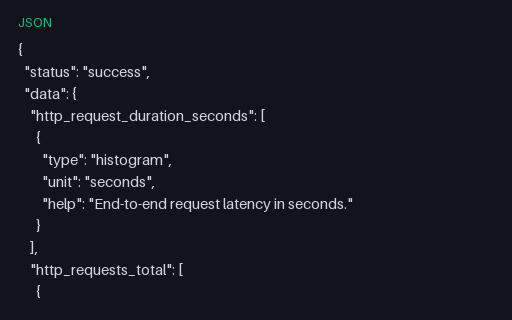
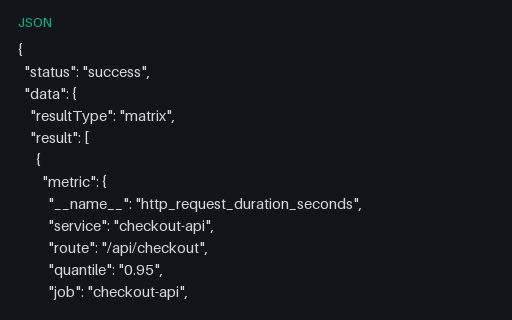
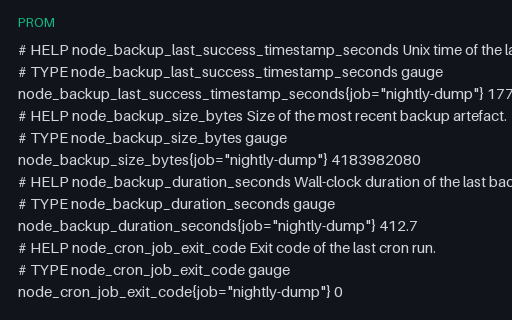
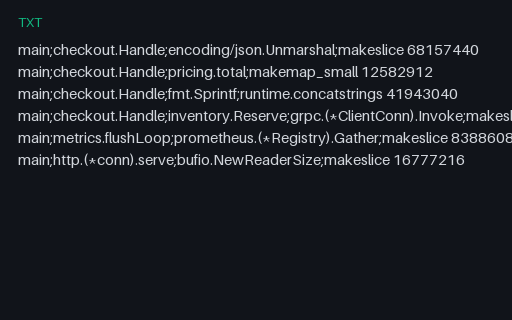
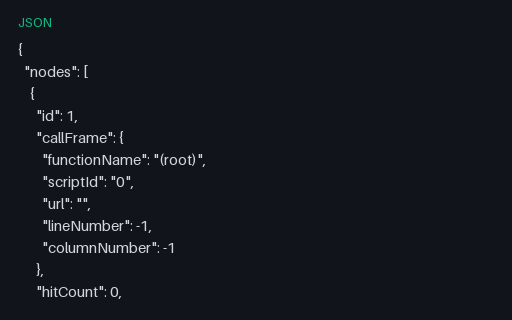
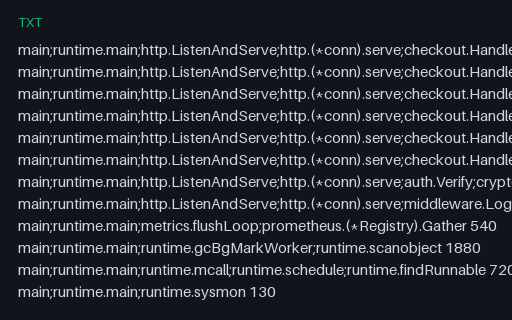
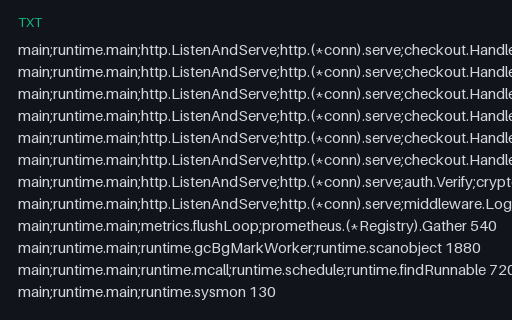
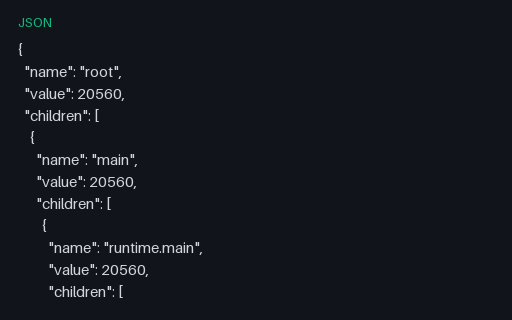
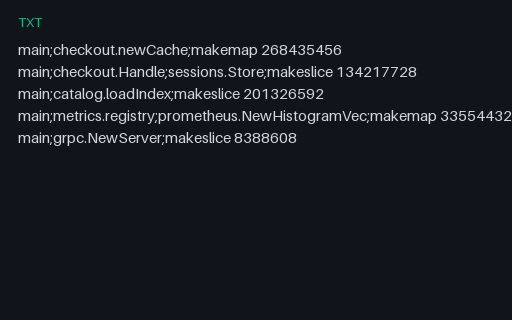
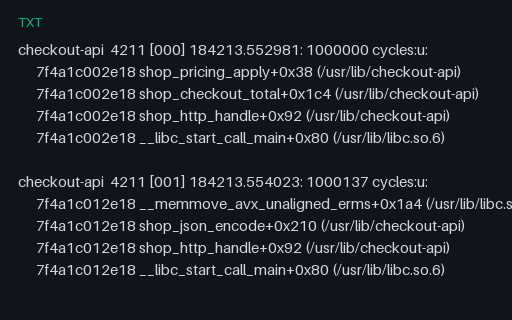
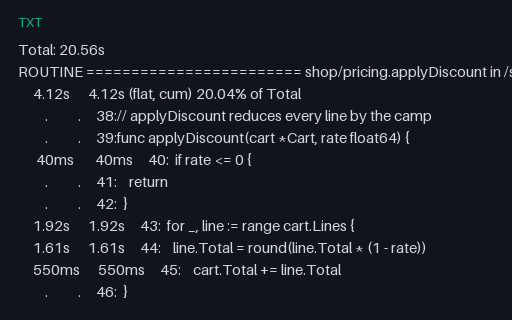
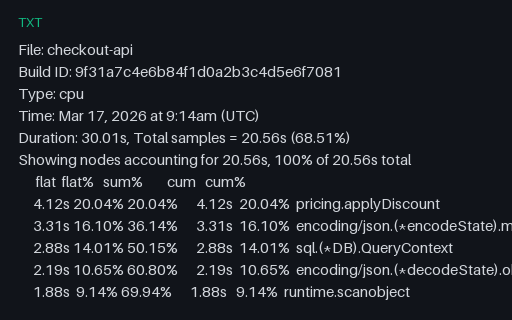
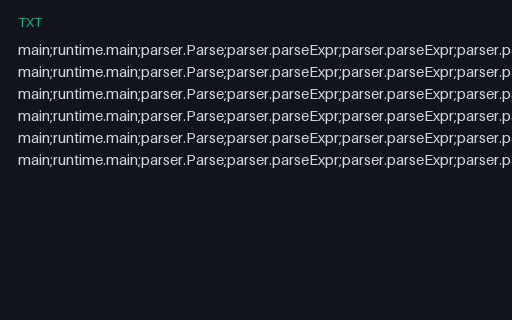
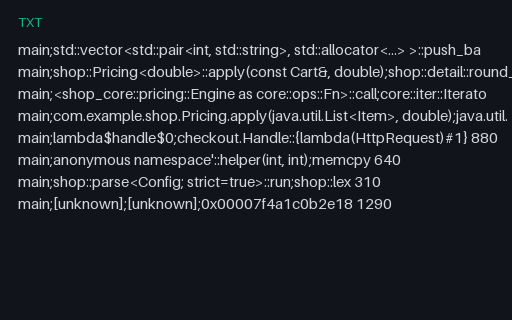
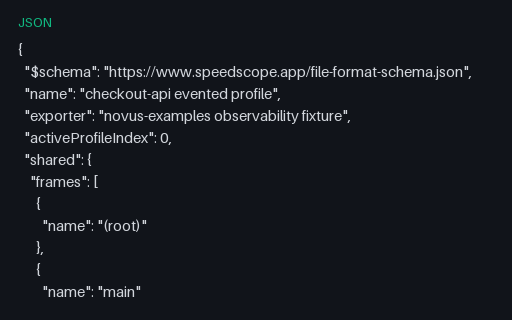
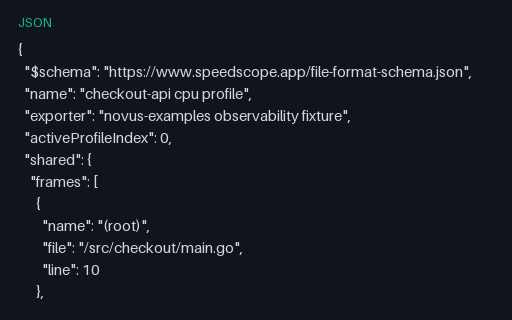
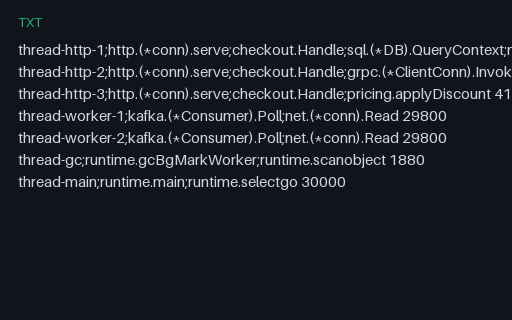
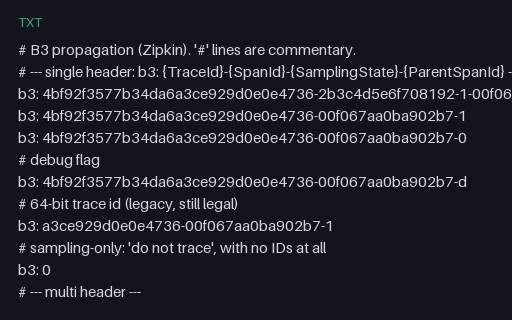
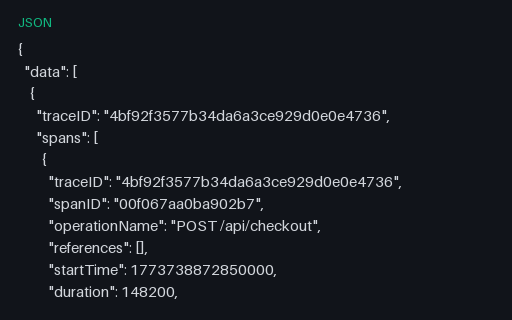
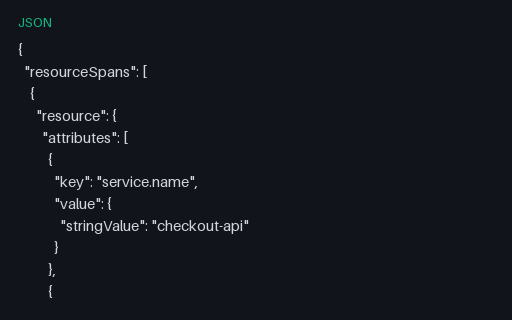
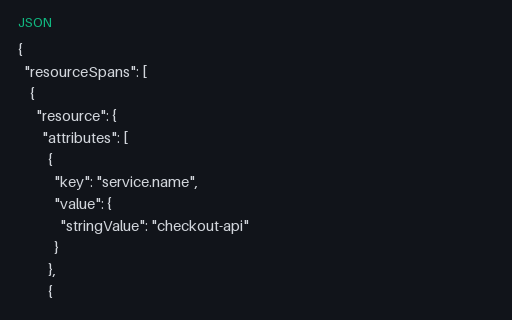
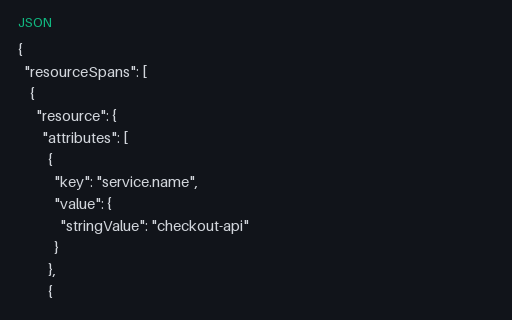
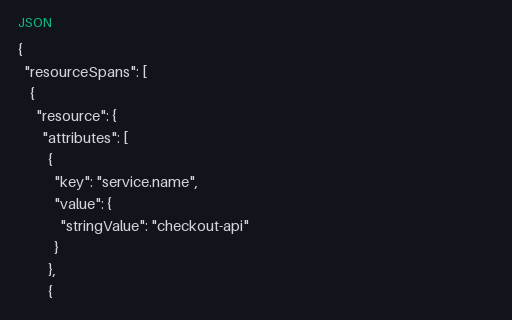
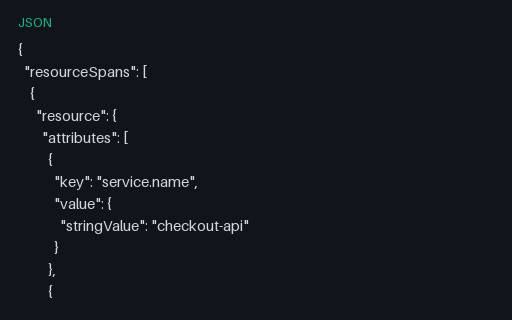
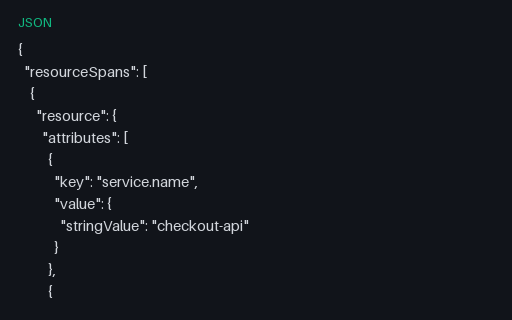
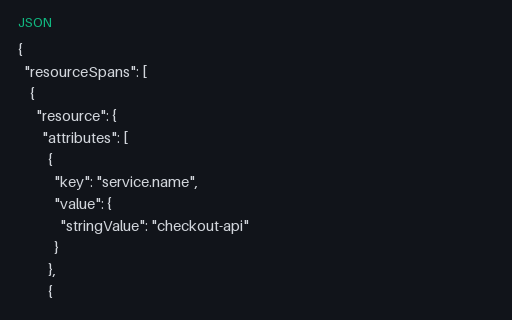
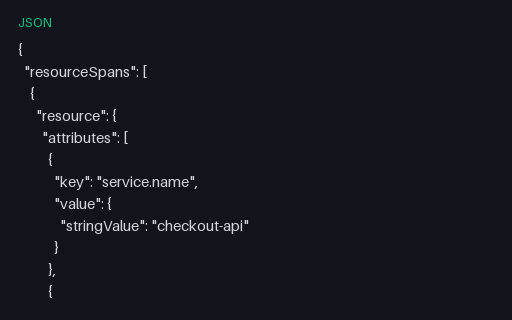
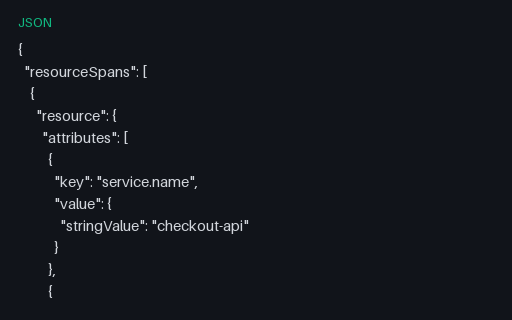
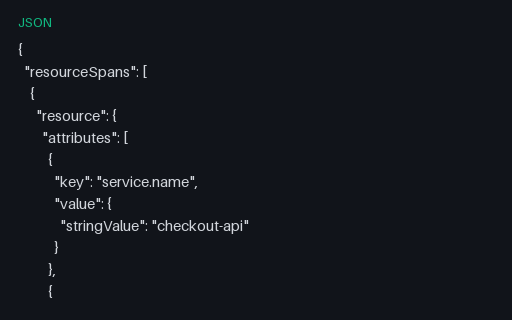
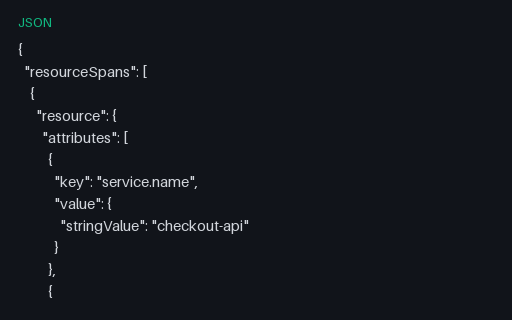
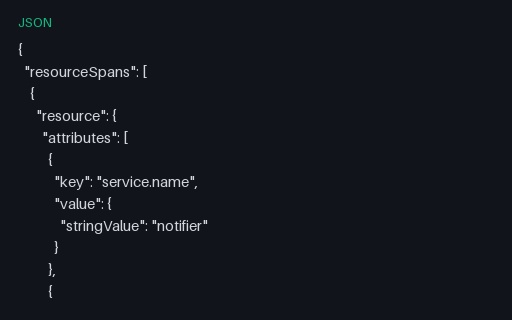
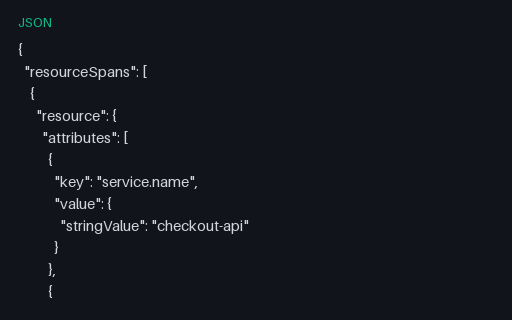
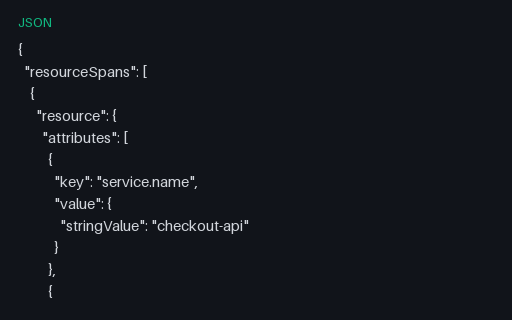
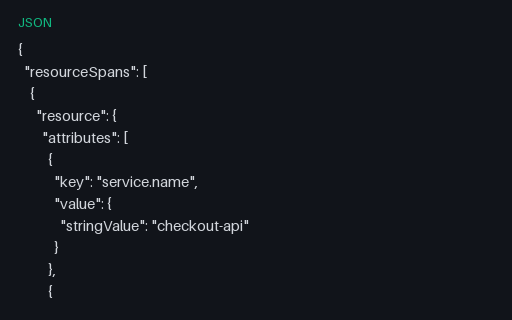
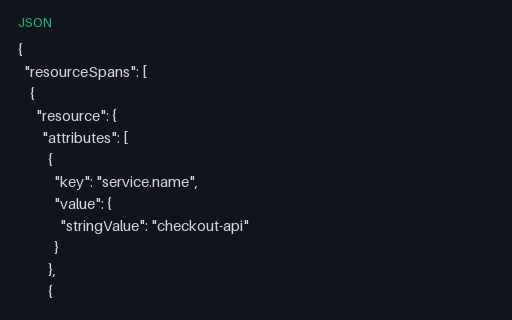
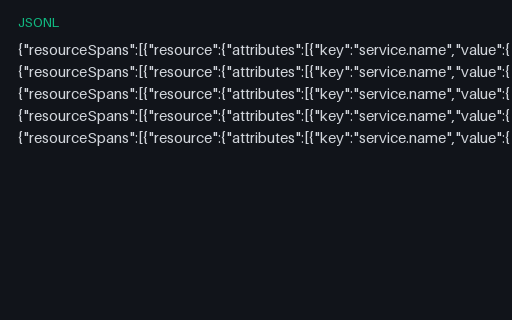
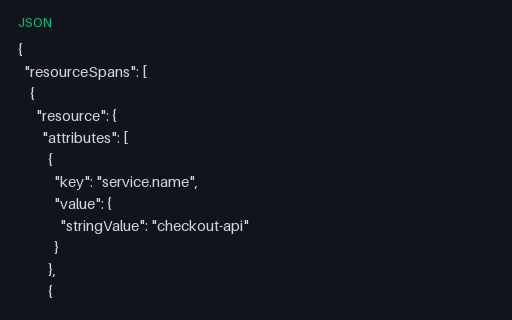
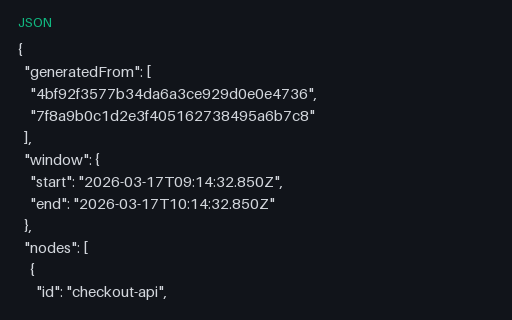
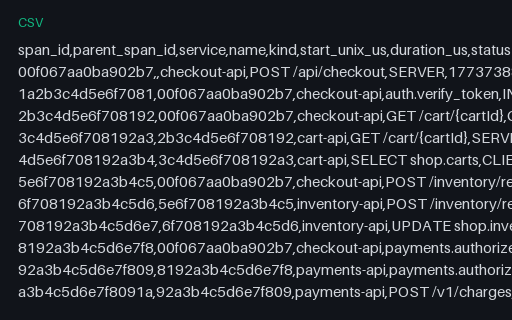
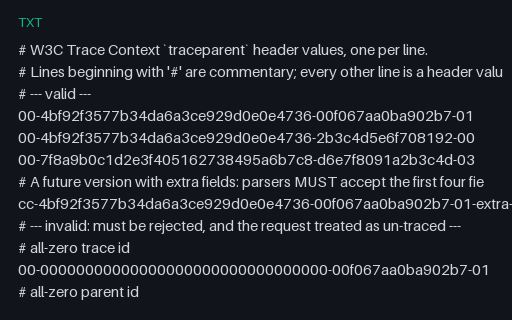
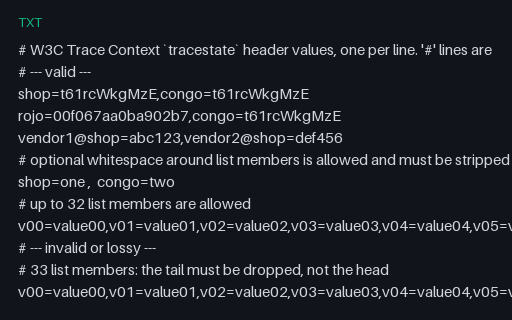
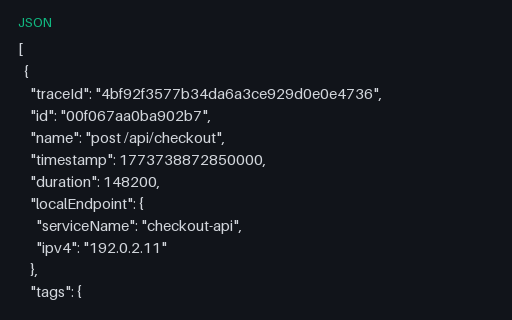
Observability pipelines are hard to test because the interesting data only appears in production. These fixtures reproduce it on disk. Traces ship as OTLP JSON and in the Jaeger and Zipkin shapes, with the same span tree across formats so a converter can be scored. Metrics come as Prometheus exposition text and OTLP metric documents covering counters, gauges, histograms, and exemplars. Logs arrive as structured JSON Lines and plain text with documented severity mixes, stack traces, multi-line records, and deliberately truncated tails. Dashboards, recording and alerting rules, collector configuration, and alert-webhook payloads complete the set. Timestamps, trace IDs, and span IDs are fixed, so two runs of your parser produce identical output.
Filter observability on Browse · 120 files · 5 subcategories
Frequently asked questions
Which telemetry shapes are included?+
OTLP JSON traces, metrics, and logs, plus Jaeger and Zipkin trace shapes, Prometheus exposition text, structured JSON Lines logs, dashboards, recording/alerting rules, and alert-webhook payloads.
Are trace and span IDs stable between downloads?+
Yes. IDs, timestamps, and durations are fixed and recorded in each file's spec, so two runs of your parser or ingest pipeline produce identical output.
Is this real production telemetry?+
No, every service name, host, and user identifier is invented. These are synthetic fixtures shaped like production data, with no real infrastructure behind them.