Skip to content
Testaroo

Deterministic files for performance testing

Documented size, row-count, duration, and resolution ladders for measuring parser, renderer, converter, and upload performance without relying on private production data.

Each card starts with one representative test file. Choose a use case, search, or filter to find a specific profile; a card’s variant menu contains its related samples.

Filter these files
More filters and sorting
More file filters

Results

29 test families · 76 available files · Page 1 of 2

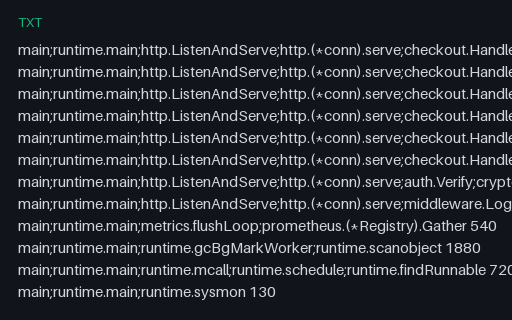
Preview of Allocation Profile: Folded Stacks Weighted in Bytes (txt)

Profiles

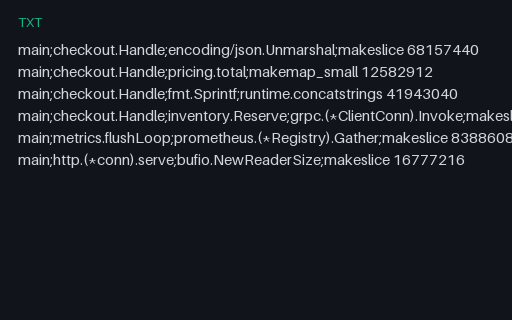
Allocation Profile: Folded Stacks Weighted in Bytes (txt)

An allocation profile in the same folded syntax as the CPU profiles, but weighted in bytes rather than samples. The format carries no unit, so a viewer that assumes samples renders 65 MB of allocation as 68 million sampl

File
TXT · Profiles
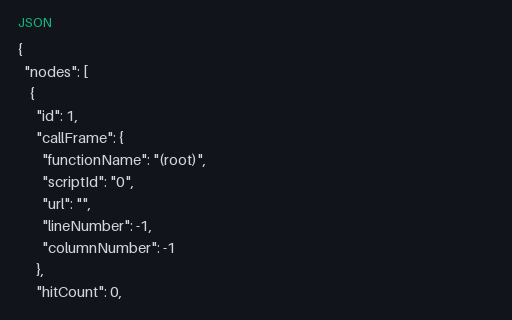
Preview of Chrome DevTools CPU Profile: Node Tree with Sample Deltas (json)

Profiles

Chrome DevTools CPU Profile: Node Tree with Sample Deltas (json)

The .cpuprofile shape V8 emits: a node tree with call frames, a samples array of node IDs and a parallel timeDeltas array, plus the synthesized (idle), (program) and (garbage collector) nodes. Counting those synthetic fr

File
JSON · Profiles
Preview of CPU Profile: Folded Stacks After a Regression (txt)

Profiles

CPU Profile: Folded Stacks After a Regression (txt)

The same workload after a change: JSON decoding costs four times as much and gains a new reflect frame, while cache lookups get cheaper. Paired with the baseline so a differential flamegraph can be scored against a known

File
TXT · Profiles
Preview of GLB: 64 Nodes Sharing One Mesh

Scene Graph

GLB: 64 Nodes Sharing One Mesh

An 8x8 field of columns built from a single 12-triangle mesh referenced by 64 nodes with seeded random heights. Core-glTF instancing needs no extension: the file is tiny, and the interesting question is whether your rend

File
GLB · Scene Graph
Preview of GLB: Float32 Vertex Baseline

Compression

GLB: Float32 Vertex Baseline

An unquantised sphere: 32-bit floats for both positions and normals, 24 bytes of attribute data per vertex. The uncompressed reference for the quantized and gzip twins in this group.

File
GLB · Compression · 3,968 triangles
Preview of GLB: Interleaved Vertex Attributes (byteStride 32)

Buffers

GLB: Interleaved Vertex Attributes (byteStride 32)

Position, normal and UV packed into ONE bufferView with byteStride 32 and three accessors at offsets 0, 12 and 24: the GPU-friendly layout, and the one a naive parser mis-reads because it assumes each accessor owns its v

File
GLB · Buffers
Preview of GLB: Sphere LOD 0 (16,128 triangles, very high)

Lod

GLB: Sphere LOD 0 (16,128 triangles, very high)

The same unit sphere at 16,128 triangles: level 0 of a four-step ladder that spans 202x from top to bottom. Because every level is generated analytically from the same surface rather than decimated, the ladder is an exac

File
GLB · Lod · 16,128 triangles
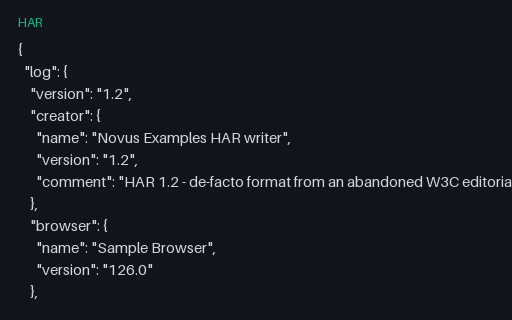
Preview of HAR: Base64-Encoded Binary Body

Har

HAR: Base64-Encoded Binary Body

A PNG response whose body is carried as base64 with content.encoding set accordingly. content.size is the DECODED byte count, not the length of the base64 string, which is the field readers most often get wrong when comp

File
HAR · Har · UTF-8
Preview of HAR: Cache State Before and After

Har

HAR: Cache State Before and After

A conditional request answered 304 with full beforeRequest and afterRequest cache state, next to a first-time fetch whose beforeRequest is null. The null is the documented way to say "not in the cache", and readers that

File
HAR · Har · UTF-8
Preview of HAR: Cookie Set, Sent and Cleared

Har

HAR: Cookie Set, Sent and Cleared

A full session-cookie lifecycle: set at login, echoed on the next request, then expired at logout with Max-Age=0. Both the header and the parsed cookies array are present, and every value (including the form password fie

File
HAR · Har · UTF-8
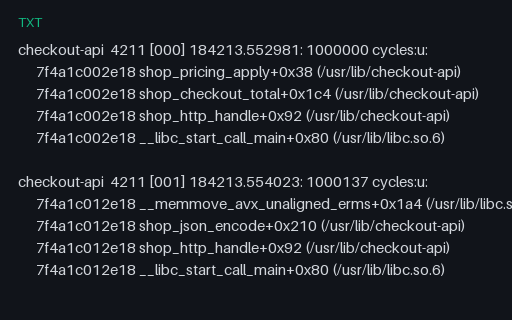
Preview of Linux perf script: Sample Records with Call Chains (txt)

Profiles

Linux perf script: Sample Records with Call Chains (txt)

Raw perf script output: a header line per sample followed by tab-indented call-chain frames with addresses, symbols, offsets and DSO paths, samples separated by blank lines. The input side of stackcollapse, including unr

File
TXT · Profiles
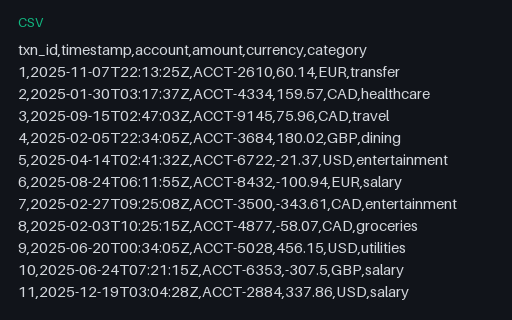
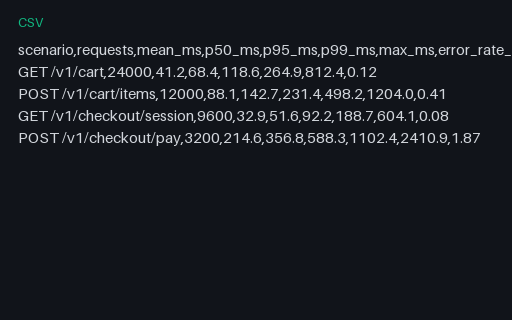
Preview of Load Test: Latency Percentiles by Scenario (CSV)

Performance

Load Test: Latency Percentiles by Scenario (CSV)

The percentile table a performance report renders as a chart, with mean, p50, p95, p99 and max for each of the four scenarios. The same numbers appear inside the JSON summary in this group, so a chart built from either s

File
CSV · Performance · 4 rows
Preview of OTF: Web Container Source, CFF (Type 2) Outlines

Web Compression

OTF: Web Container Source, CFF (Type 2) Outlines

The uncompressed CFF (Type 2) source for this container set. Every WOFF and WOFF2 file in the group is packed from exactly these bytes, so a compression comparison is measuring the container and nothing else. Original ty

File
OTF · Web Compression
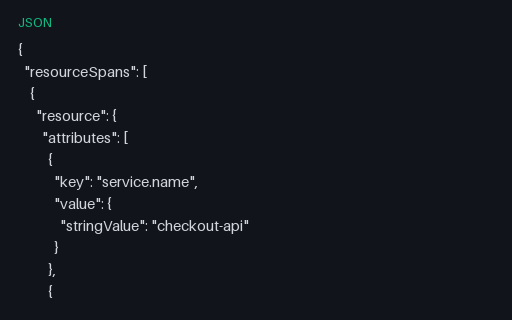
Preview of OTLP Trace: 48-Span Linear Chain (json)

Traces

OTLP Trace: 48-Span Linear Chain (json)

A single-service trace 48 levels deep: a recursive GraphQL-style resolver where every span is the child of the one before it. A depth fixture for waterfall renderers, tree-layout code and any parser that recurses over pa

File
JSON · Traces