
csv
473 BClean CSV
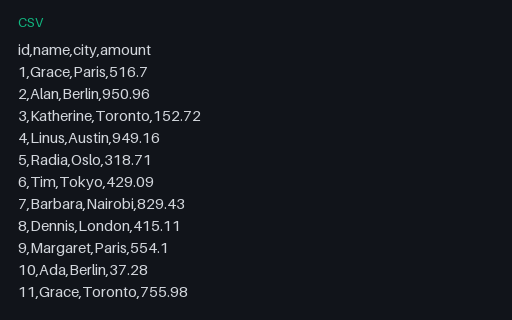
A clean, well-formed CSV with a header and 20 rows: the baseline case for CSV parser testing.
- File
- CSV · CSV · 20 rows
- Use case
- CSV parsingData import
Clean and deliberately messy CSVs, quoted commas, embedded newlines, ragged rows, odd delimiters, and encodings.
A clean, well-formed CSV with a header and 20 rows: the baseline case for CSV parser testing.
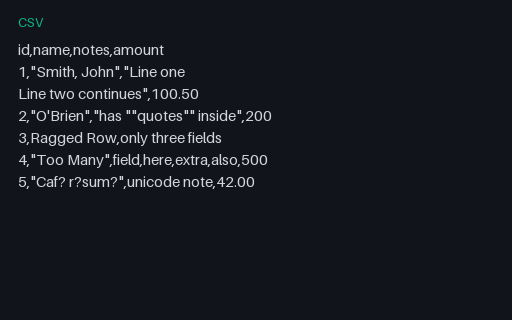
A deliberately messy CSV: a quoted field with a comma, a quoted field with an embedded newline, escaped double-quotes, and ragged rows with too few and too many fields, the cases that break naïve parsers.
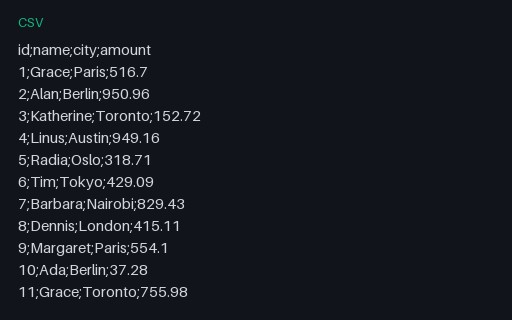
A CSV that uses semicolons as the delimiter (common in European locales), for testing delimiter detection.
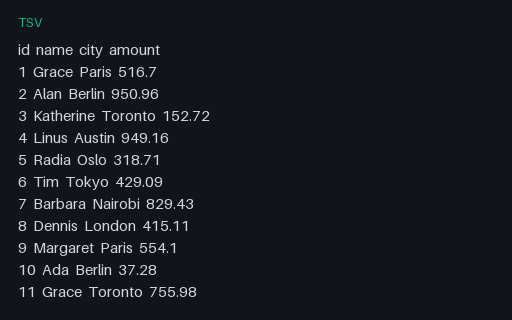
A tab-separated values file with a header and 20 rows, for testing TSV parsing and delimiter handling.
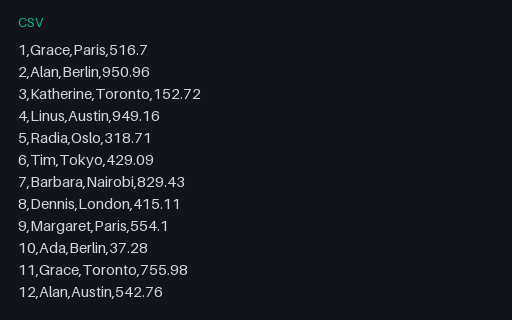
A CSV with no header row, for testing parsers that must infer or be told the column names.
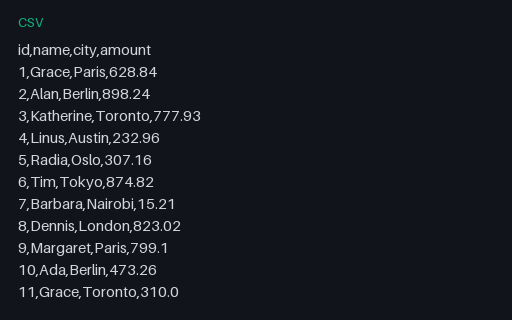
A CSV with 10,000 data rows, for testing streaming parsers, memory handling, and import performance.
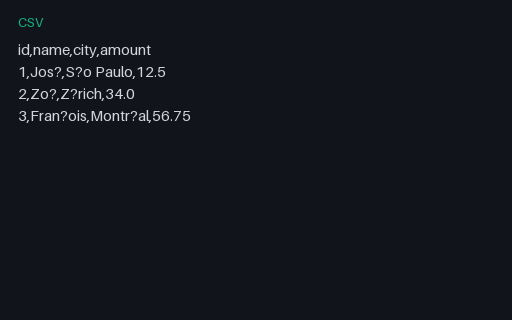
A CSV encoded in Latin-1 (ISO-8859-1) with accented names, for testing encoding detection and mis-decoding (it will look wrong if read as UTF-8).
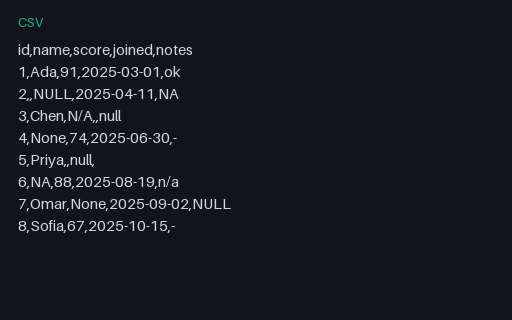
A CSV where missing values are written seven different ways (empty string, NULL, NA, N/A, null, None, and a dash) across text and numeric columns. A fixture for testing null-detection and coercion in CSV importers.
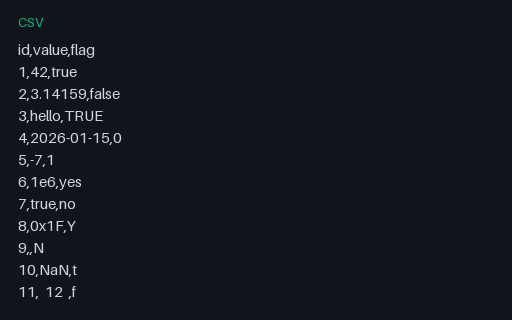
A CSV whose 'value' column mixes integers, floats, scientific notation, dates, hex, thousands separators, and whitespace, and whose 'flag' column mixes a dozen boolean spellings. A torture test for type inference and schema detection.
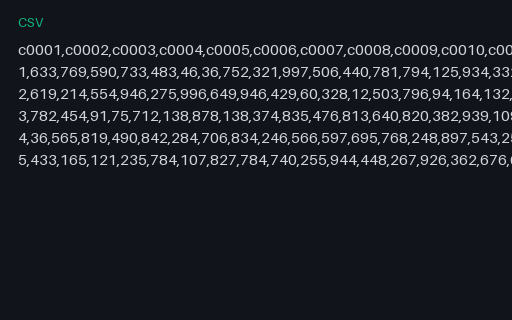
A CSV with 1000 columns and a handful of rows: a stress test for parsers, spreadsheet importers, and databases with column limits or per-row buffering assumptions. Deterministic (fixed seed).
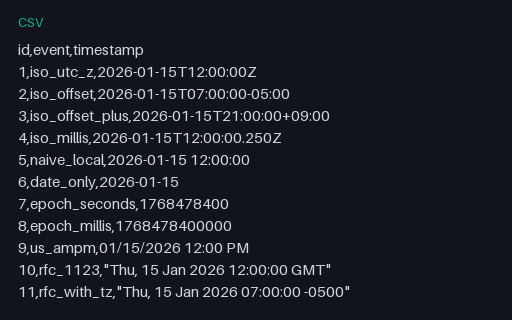
A CSV listing timestamps in eleven formats: ISO 8601 with Z and numeric offsets, millisecond precision, naive local, date-only, Unix epoch in seconds and milliseconds, US AM/PM, and RFC 1123. A fixture for testing date parsing and timezone normalisation.
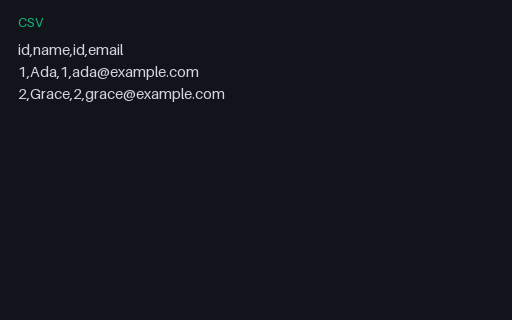
A small CSV whose header row repeats the column name id: a common importer failure mode.
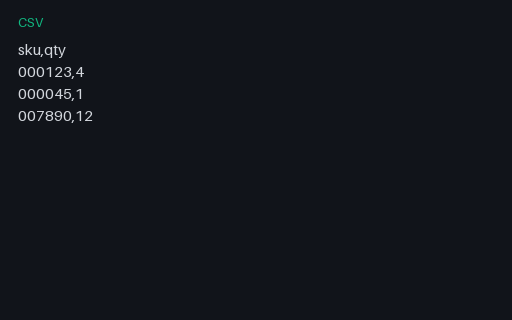
SKU identifiers that start with zeros. Spreadsheet tools often coerce these to numbers and drop the zeros. Keep them as text.
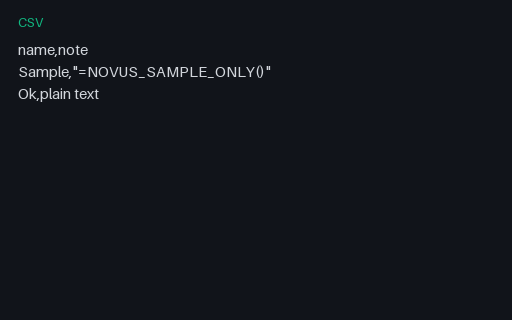
A sanitization-test CSV with one equals-prefixed cell clearly labelled sample-only. Use it to verify importers neutralize spreadsheet formulas, not an attack list.
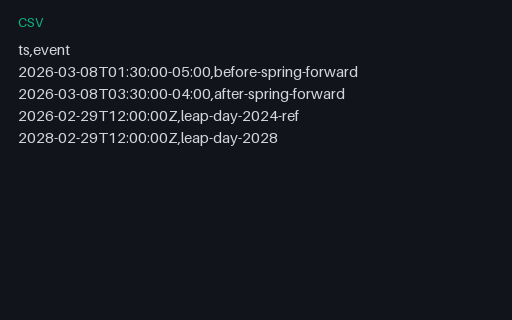
Timestamps spanning a US spring-forward DST gap and leap-day dates for timezone and calendar edge-case testing.
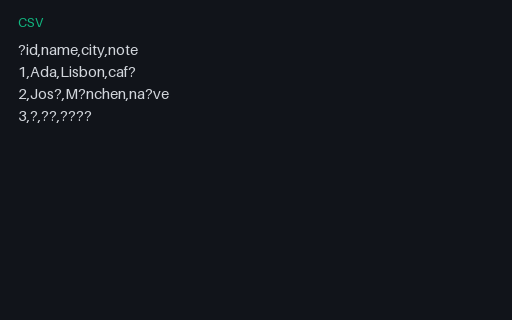
A CSV prefixed with a UTF-8 BOM (EF BB BF) and accented / CJK cells, for testing BOM-aware importers.
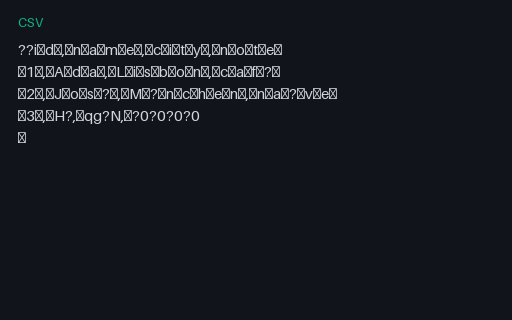
The same three data rows as UTF-16 little-endian with a BOM, wide-character CSV decoding fixture.
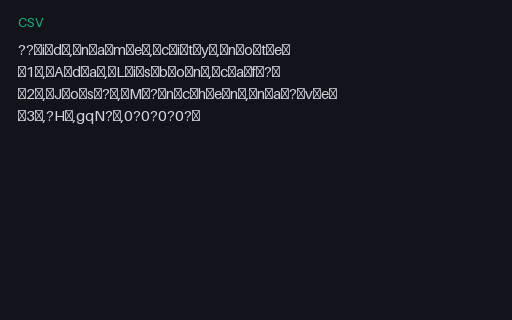
UTF-16 big-endian CSV with BOM, for byte-order detection in tabular importers.
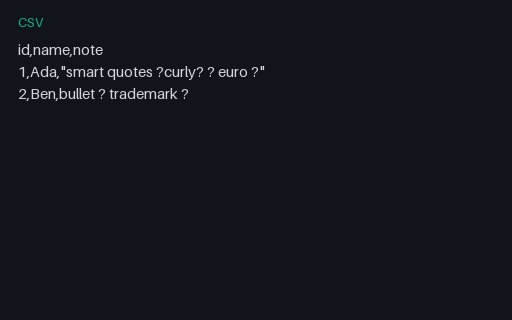
A CP1252 CSV using the 0x80–0x9F range (smart quotes, euro, bullet) that Latin-1 misreads.

A Shift-JIS encoded Japanese CSV, for CJK charset detection and Shift-JIS→UTF-8 conversion in importers.
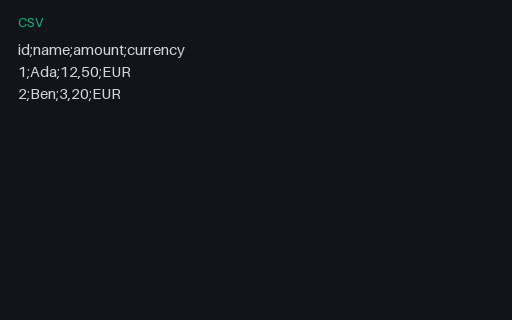
European-style CSV using semicolons as delimiters and comma decimals: a common locale edge case.
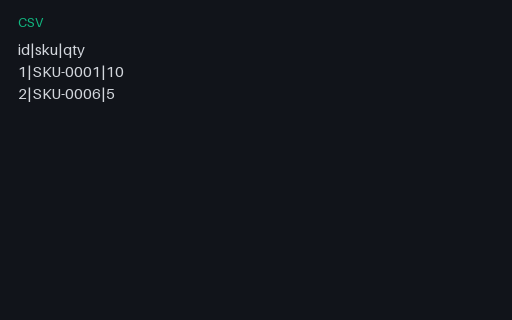
A pipe-delimited (| ) tabular file, for testing non-comma delimiter autodetection.
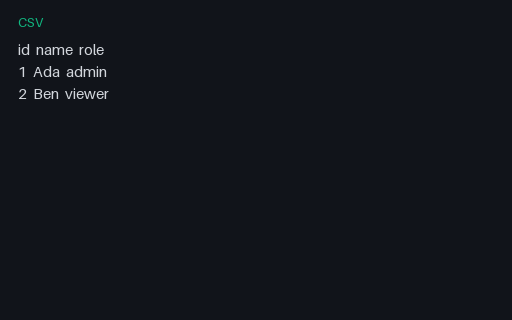
A .csv file whose content is tab-delimited. Tests whether importers sniff delimiters or trust the extension.
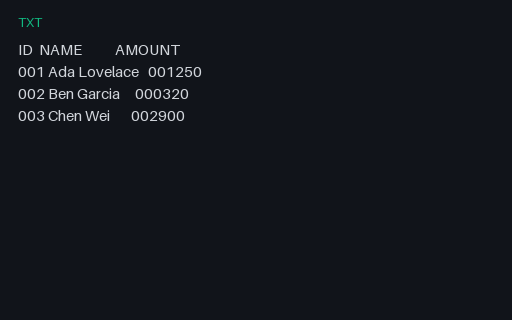
A classic fixed-width text extract with documented column positions, for COBOL-style / mainframe importer tests.
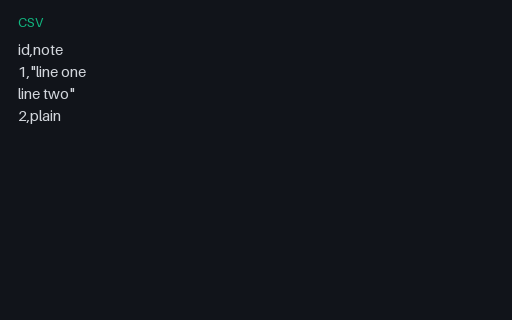
A CSV with a quoted field that contains an embedded newline: a classic RFC 4180 parser stress case.
A CSV that mixes CRLF and LF row endings within one file: newline normalisation fixture.
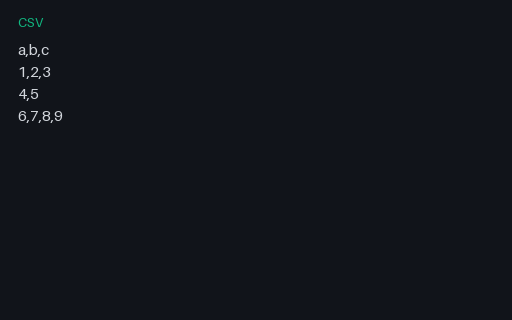
Rows with differing field counts, for testing how importers pad, truncate, or error on ragged CSV.
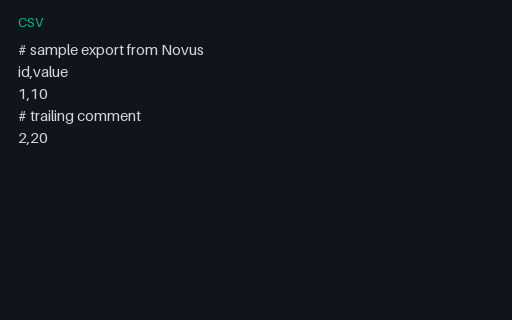
A CSV with # comment lines mixed among data: common in scientific exports; tests comment skipping.
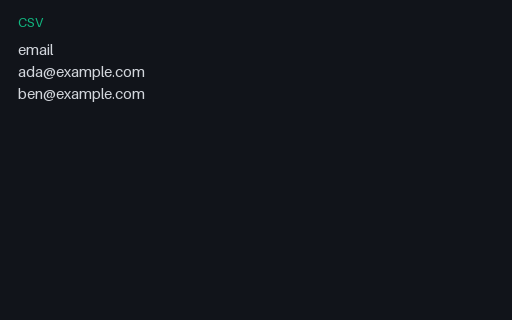
A one-column CSV of email addresses: edge case for delimiter sniffers that expect commas in every row.
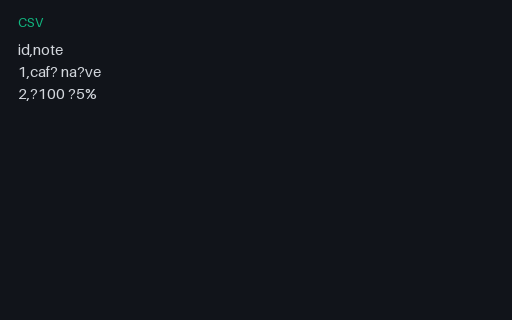
A Latin-1 CSV with high-bit accented characters, for legacy 8-bit charset detection.
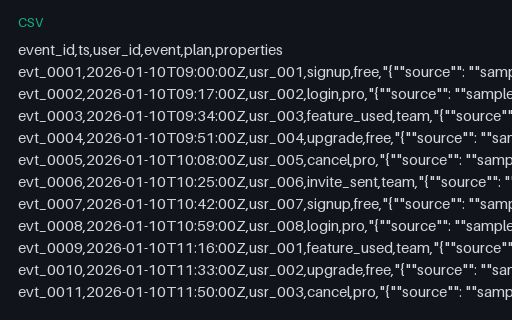
Synthetic product-analytics events (signup/login/upgrade) for testing event pipelines and warehouse loads. CSV twin.
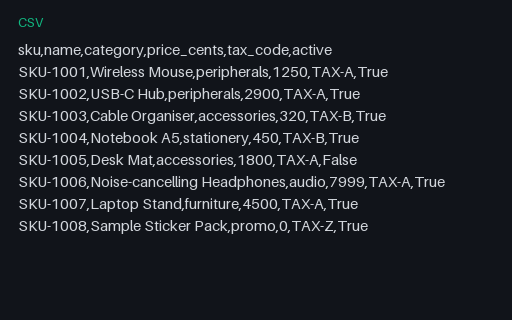
A point-of-sale SKU catalog with tax codes and active flags: fictional Meridian Supply inventory. CSV twin.
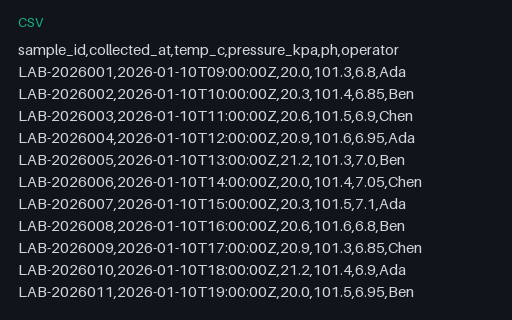
Synthetic lab readings (temperature, pressure, pH) with ISO timestamps for scientific ETL tests. CSV twin.
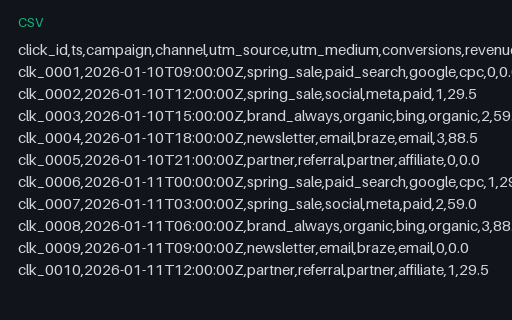
Synthetic multi-touch attribution click rows with UTM fields, for marketing analytics importers. CSV twin.
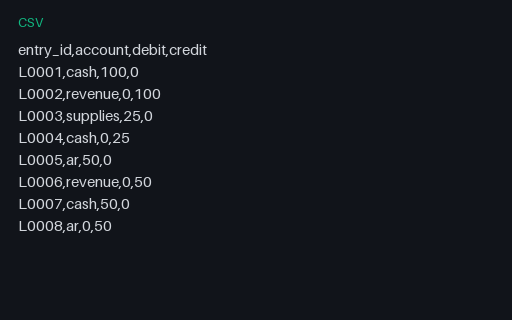
Synthetic finance dataset (ledger-lines) as CSV, for ETL and warehouse loader tests.
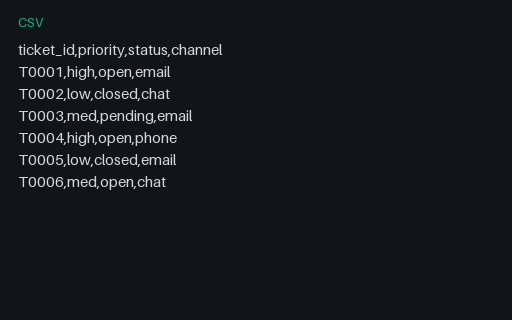
Synthetic support dataset (tickets) as CSV, for ETL and warehouse loader tests.
Deterministic synthetic CSV batch 01 for bulk-import smoke tests.
Deterministic synthetic CSV batch 02 for bulk-import smoke tests.
Deterministic synthetic CSV batch 03 for bulk-import smoke tests.
Deterministic synthetic CSV batch 04 for bulk-import smoke tests.
Deterministic synthetic CSV batch 05 for bulk-import smoke tests.
Deterministic synthetic CSV batch 06 for bulk-import smoke tests.
Deterministic synthetic CSV batch 07 for bulk-import smoke tests.
Deterministic synthetic CSV batch 08 for bulk-import smoke tests.
Deterministic synthetic CSV batch 09 for bulk-import smoke tests.
Deterministic synthetic CSV batch 10 for bulk-import smoke tests.
Deterministic synthetic CSV batch 11 for bulk-import smoke tests.
Deterministic synthetic CSV batch 12 for bulk-import smoke tests.
Deterministic synthetic CSV batch 13 for bulk-import smoke tests.
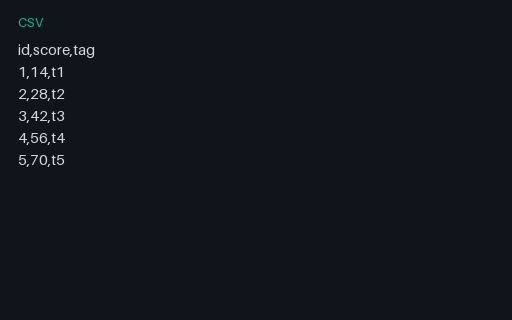
Deterministic synthetic CSV batch 14 for bulk-import smoke tests.
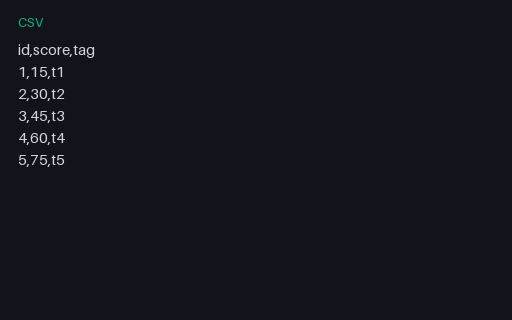
Deterministic synthetic CSV batch 15 for bulk-import smoke tests.
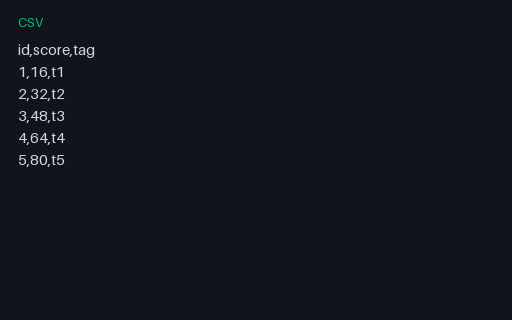
Deterministic synthetic CSV batch 16 for bulk-import smoke tests.
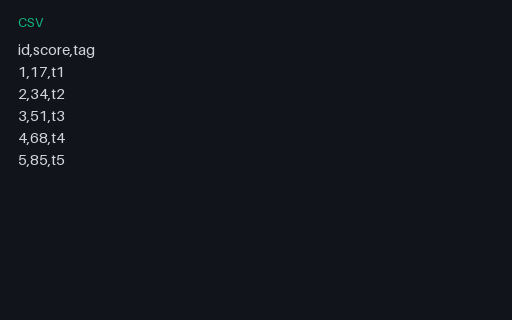
Deterministic synthetic CSV batch 17 for bulk-import smoke tests.
Deterministic synthetic CSV batch 18 for bulk-import smoke tests.
Deterministic synthetic CSV batch 19 for bulk-import smoke tests.
Deterministic synthetic CSV batch 20 for bulk-import smoke tests.
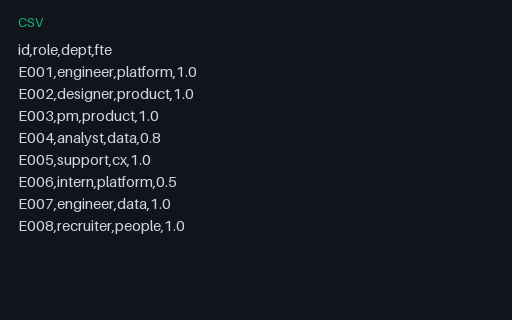
Synthetic hr dataset (employees-mini) as CSV, for ETL and warehouse loader tests.
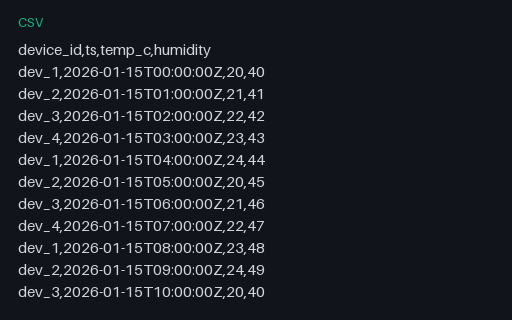
Synthetic iot dataset (sensor-readings-mini) as CSV, for ETL and warehouse loader tests.
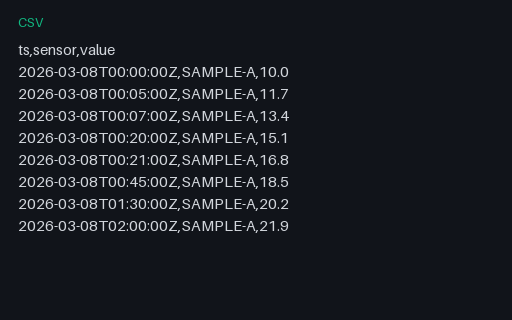
Sensor readings at irregular minute gaps. Tests time-series resampling and gap detection.
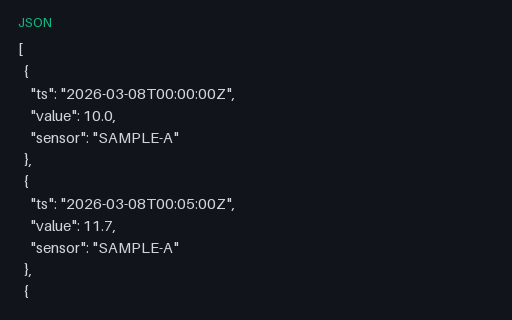
JSON twin of irregular-interval sensor readings for charting library tests.
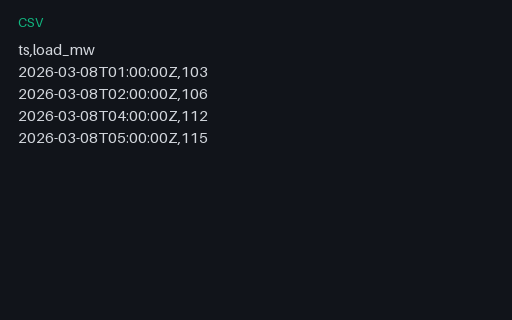
Hourly load data skipping the 03:00 hour on DST spring-forward day. Tests timezone/DST gap handling.
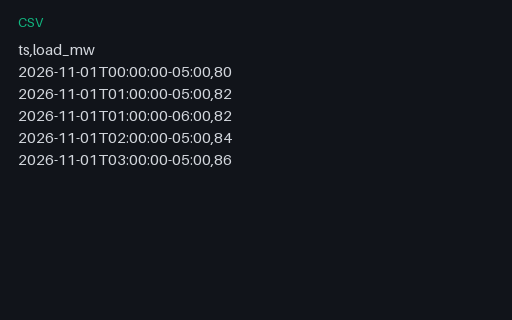
Load readings with a repeated 01:00 local hour on fall-back DST. Tests ambiguous timestamp handling.
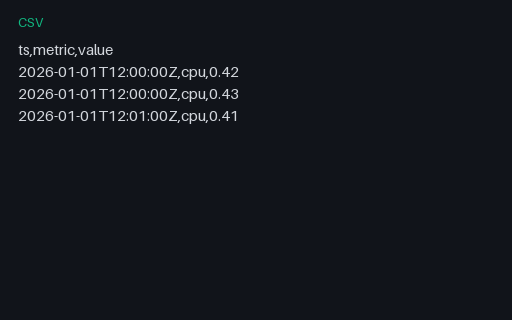
Two rows share the same timestamp key. Tests deduplication and last-write-wins policies.
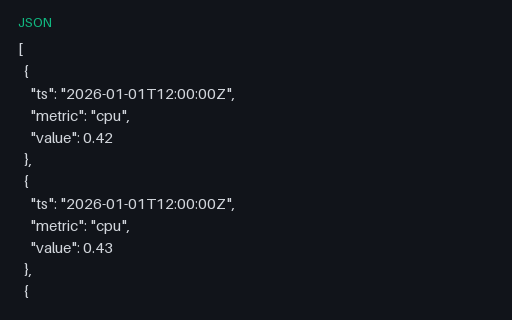
JSON array with duplicate timestamp keys for ingestion pipeline tests.
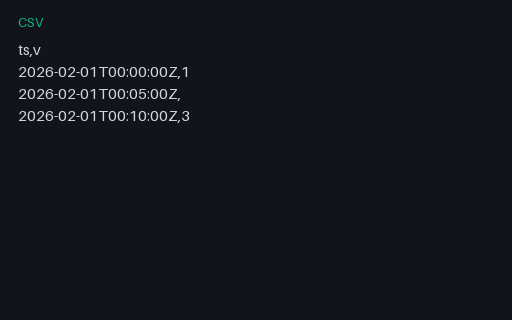
Series with an explicit null value at a missing sample point.
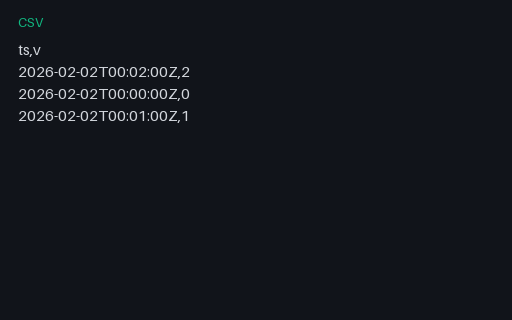
Timestamps out of chronological order. Tests sort-on-ingest behaviour.
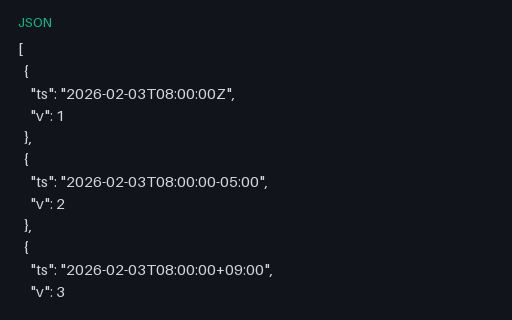
Same nominal instant expressed in Z, -05:00, and +09:00 offsets.
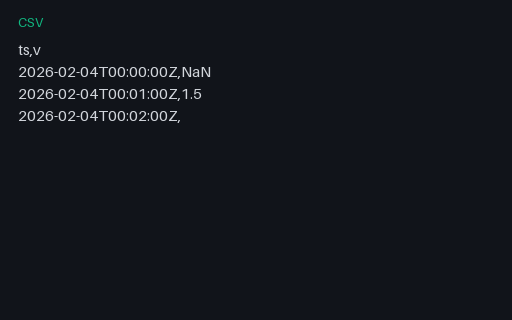
CSV with NaN string and empty cells representing missing measurements.
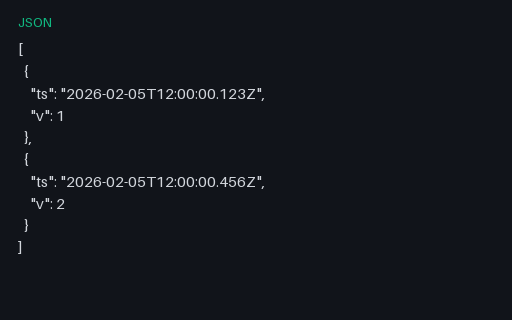
Sub-second millisecond timestamps for precision parsing tests.
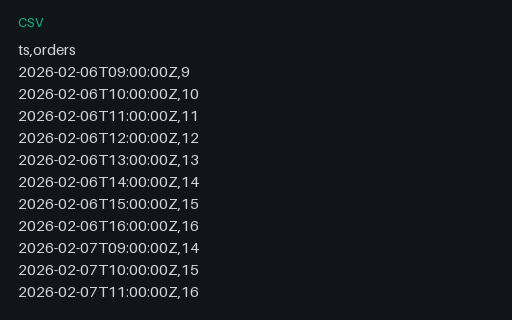
Hourly order counts weekdays only (09–16 UTC) across three SAMPLE days.
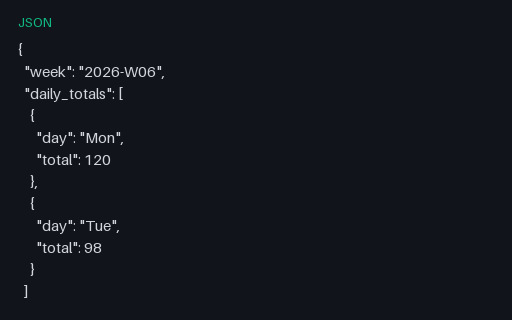
Pre-aggregated weekly totals JSON for rollup/chart tests.
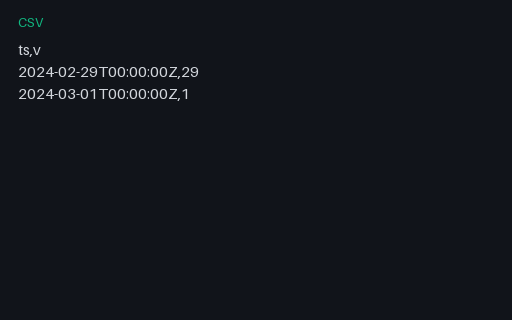
Readings spanning Feb 29 leap day: calendar edge case.
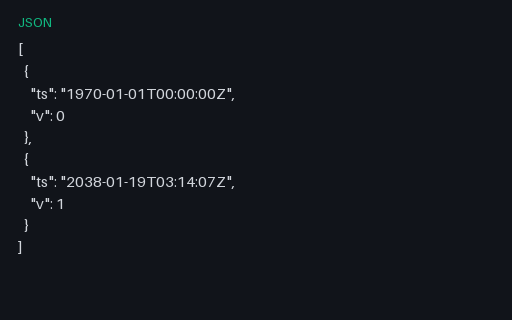
Timestamps at Unix epoch and classic 32-bit Y2038 boundary.
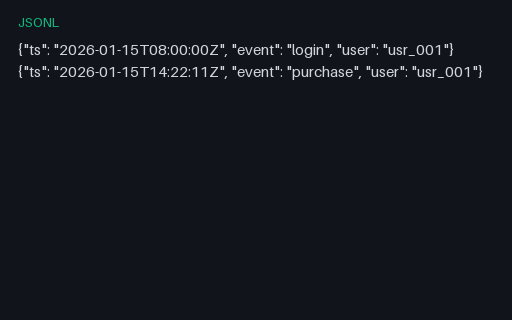
Sparse event log in JSON Lines: two events hours apart for event-stream ingestion tests.
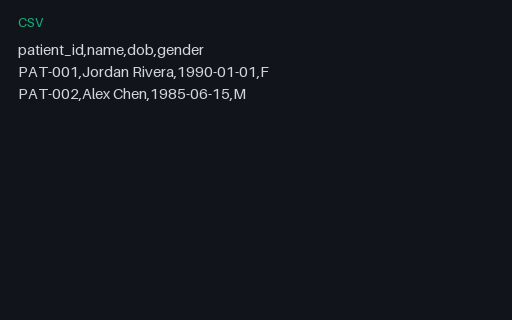
Synthetic patient demographics CSV for EHR import and de-identification pipeline tests.
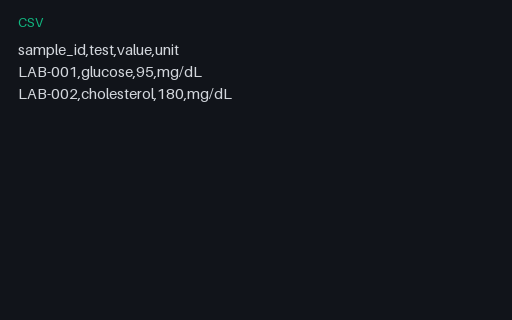
Synthetic lab result rows for clinical data warehouse import tests.
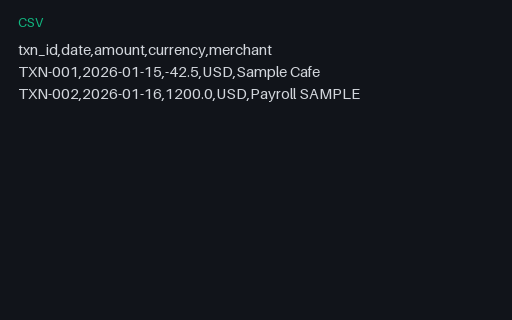
Synthetic bank transaction history for personal-finance importer tests.
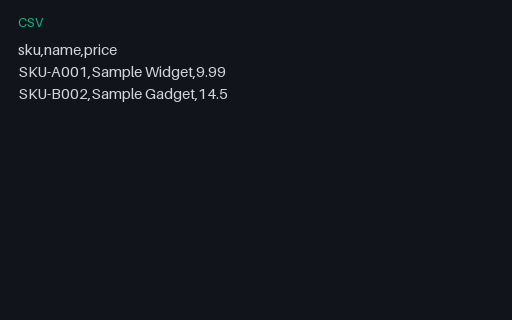
Fictional SKU catalog for ERP and POS import tests.
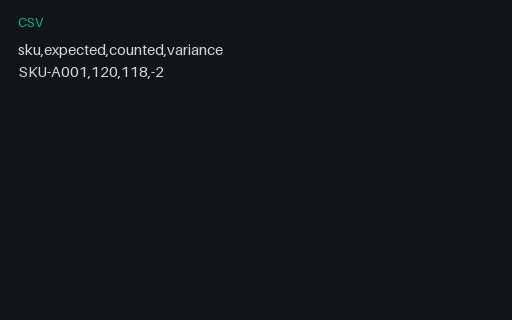
Cycle-count variance SAMPLE for inventory audit reconciliation tests.
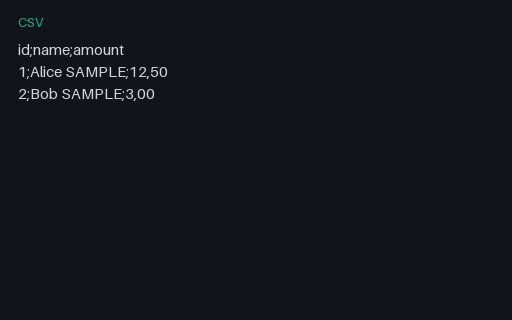
Tiny SAMPLE CSV (semicolon-eu) exercising delimiter/quoting edge behaviour.
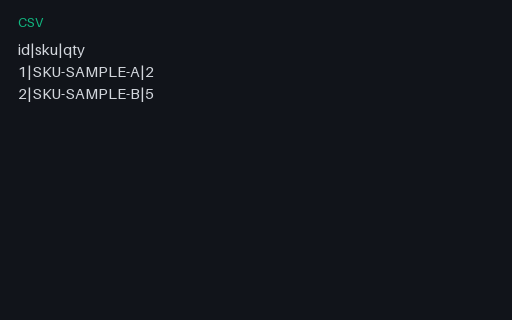
Tiny SAMPLE CSV (pipe-delimited) exercising delimiter/quoting edge behaviour.
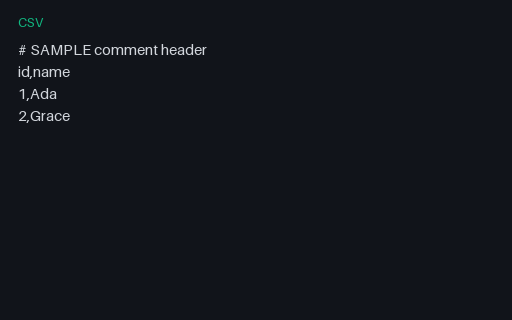
Tiny SAMPLE CSV (hash-commented) exercising delimiter/quoting edge behaviour.
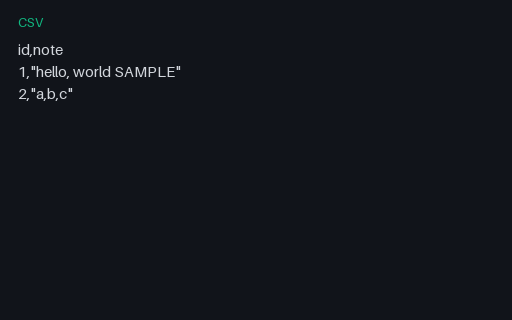
Tiny SAMPLE CSV (quoted-embedded-comma) exercising delimiter/quoting edge behaviour.
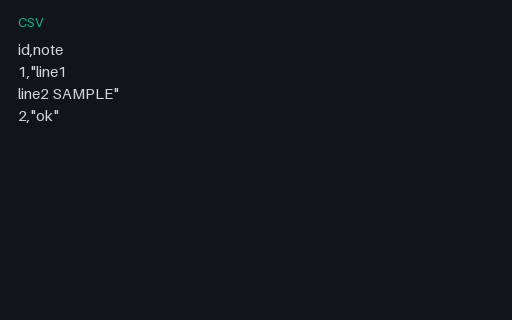
Tiny SAMPLE CSV (quoted-embedded-newline) exercising delimiter/quoting edge behaviour.
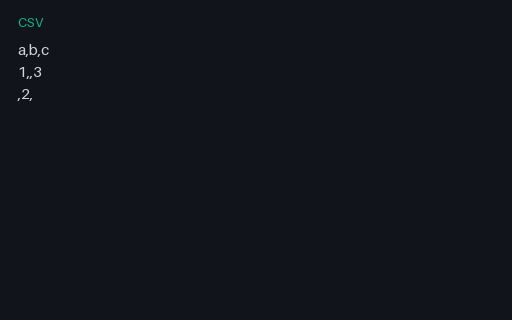
Tiny SAMPLE CSV (empty-fields) exercising delimiter/quoting edge behaviour.
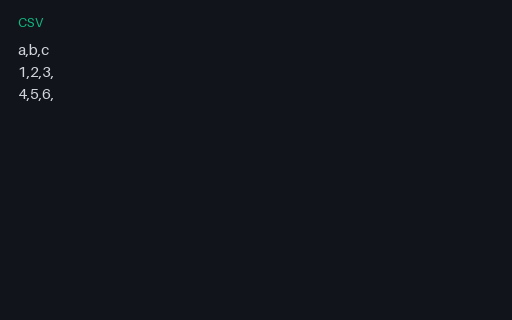
Tiny SAMPLE CSV (trailing-comma) exercising delimiter/quoting edge behaviour.

Tiny SAMPLE CSV (header-only) exercising delimiter/quoting edge behaviour.
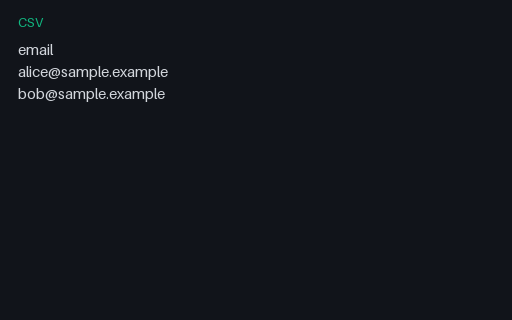
Tiny SAMPLE CSV (single-column) exercising delimiter/quoting edge behaviour.
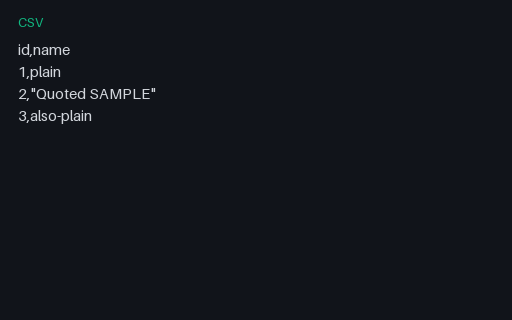
Tiny SAMPLE CSV (mixed-quoting) exercising delimiter/quoting edge behaviour.
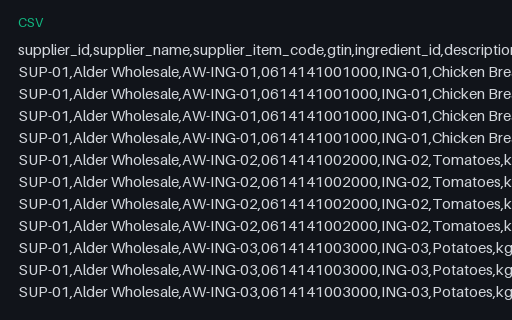
Supplier price list CSV for Alder Table Bistro. 48 rows covering 2 suppliers, 6 items and 4 effective dates (2026-08-05, 2026-08-12, 2026-08-19, 2026-08-26). Each row carries the list unit price, the case pack quantity, the price per case and a contract tier price that applies only at 250 units. Every purchase order line in this set is priced from the row matching its supplier, item and order date.
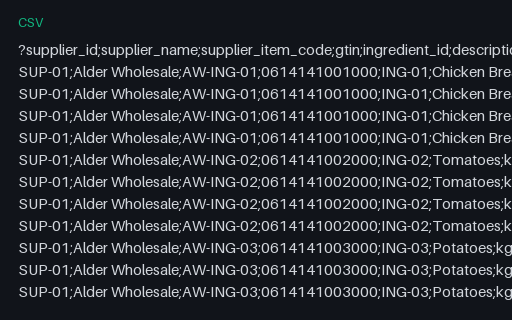
Supplier price list CSV, semicolon and decimal comma for Alder Table Bistro. The same 48 price rows re-exported the way a European supplier portal writes them: UTF-8 with a byte-order mark (EF BB BF), semicolon field separators, CRLF line endings, and decimal commas in list_unit_price, price_per_case and contract_tier_unit_price. Column names, column order and every value are identical to price-list.csv; only the encoding and the separators differ.
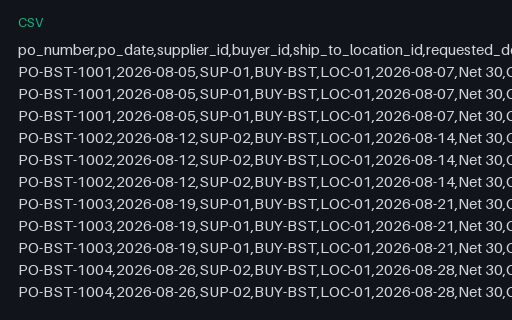
Purchase order lines CSV for Alder Table Bistro. 12 lines across 4 purchase orders dated 2026-08-05 to 2026-08-26. Each line repeats its order's net, tax and gross totals, so a reader can check that the line values sum to the header without a second file. Order PO-BST-1002 totals 329.53 CAD including GST.
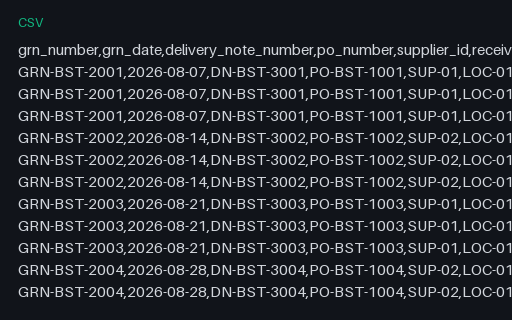
Goods-received note lines CSV for Alder Table Bistro. 12 received lines across 4 goods-received notes. Three lines are exceptions: a short delivery of 4 units on GRN-BST-2002, an item substitution on GRN-BST-2003 where the delivered ingredient id differs from the ordered one, and a part return of 3 units on GRN-BST-2004. accepted_quantity equals delivered_quantity minus returned_quantity on every row.
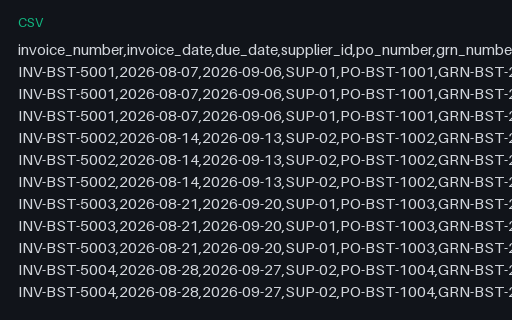
Supplier invoice lines CSV for Alder Table Bistro. 14 lines across 5 invoice documents that carry only 4 distinct invoice numbers: INV-BST-5002 appears twice, dated 2026-08-14 and 2026-08-17. invoice_number is therefore not a key; the pair of invoice_number and invoice_date is. invoice_stated_tax_total is the figure printed on the document, which for INV-BST-5003 is one cent above the sum of its line tax amounts.
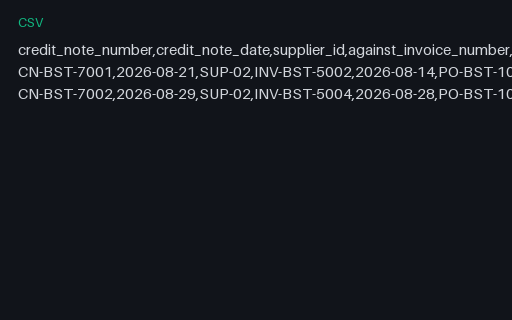
Credit note lines CSV for Alder Table Bistro. 2 credit lines, one per note. CN-BST-7001 credits 4 units for the short delivery and agrees with the goods-received note. CN-BST-7002 credits 5 units where GRN-BST-2004 records only 3 returned, an overstatement of 15.58 CAD net.
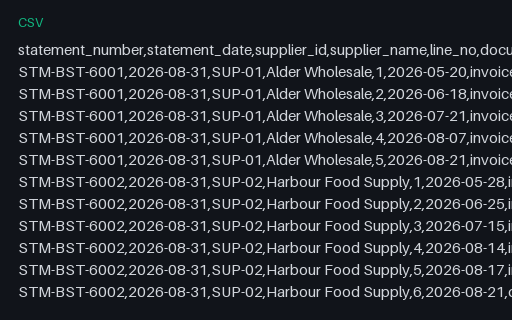
Statements of account CSV for Alder Table Bistro. 13 transaction rows across 2 month-end statements dated 2026-08-31. STM-BST-6001 closes at 1326.11 CAD and its four declared ageing buckets sum to exactly that. STM-BST-6002 closes at 1559.75 CAD while its declared buckets sum to 1566.76 CAD.
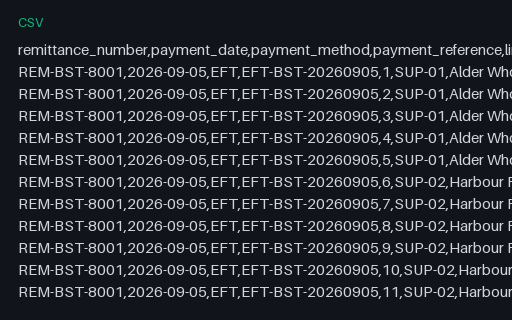
Remittance advice lines CSV for Alder Table Bistro. 13 lines, one for every document on both statements, each marked paid or withheld with a reason. 1120.68 CAD is settled and 1765.18 CAD is withheld against statement balances of 2885.86 CAD; the first two figures sum to the third.
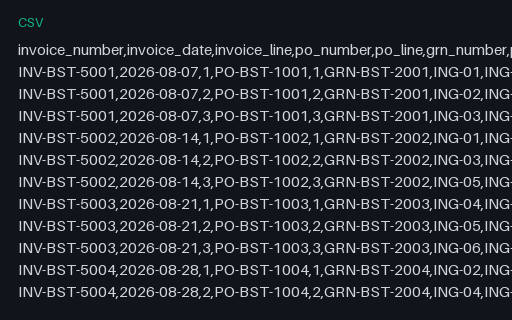
Three-way match report CSV for Alder Table Bistro. 14 rows joining every invoice line to its purchase order line and its goods-received line. 9 rows match on item, quantity and price; the remaining 5 carry a match_result of duplicate-invoice-number, item-substituted, matched-credit-expected, quantity-variance and a note giving the exact variance.
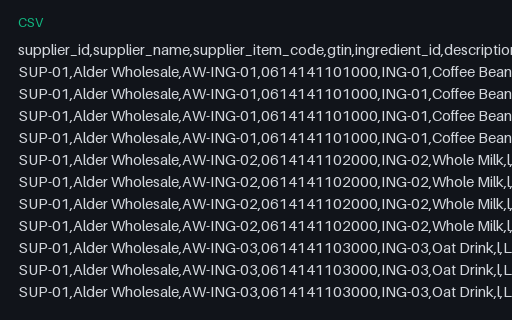
Supplier price list CSV for Juniper Corner Cafe. 48 rows covering 2 suppliers, 6 items and 4 effective dates (2026-08-05, 2026-08-12, 2026-08-19, 2026-08-26). Each row carries the list unit price, the case pack quantity, the price per case and a contract tier price that applies only at 250 units. Every purchase order line in this set is priced from the row matching its supplier, item and order date.
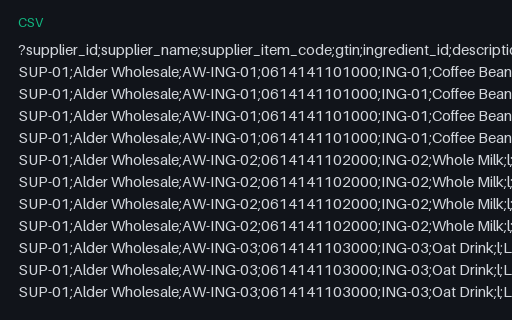
Supplier price list CSV, semicolon and decimal comma for Juniper Corner Cafe. The same 48 price rows re-exported the way a European supplier portal writes them: UTF-8 with a byte-order mark (EF BB BF), semicolon field separators, CRLF line endings, and decimal commas in list_unit_price, price_per_case and contract_tier_unit_price. Column names, column order and every value are identical to price-list.csv; only the encoding and the separators differ.
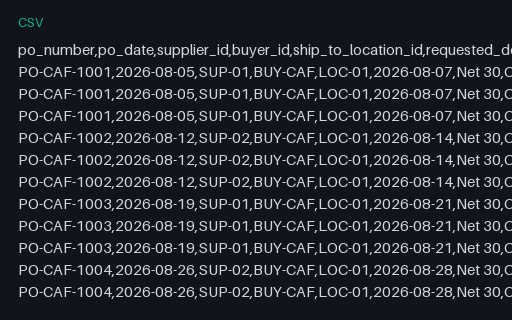
Purchase order lines CSV for Juniper Corner Cafe. 12 lines across 4 purchase orders dated 2026-08-05 to 2026-08-26. Each line repeats its order's net, tax and gross totals, so a reader can check that the line values sum to the header without a second file. Order PO-CAF-1002 totals 348.83 CAD including GST.
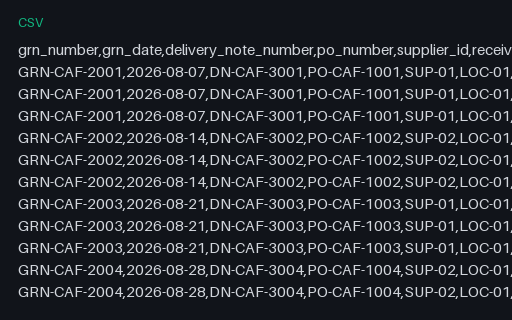
Goods-received note lines CSV for Juniper Corner Cafe. 12 received lines across 4 goods-received notes. Three lines are exceptions: a short delivery of 4 units on GRN-CAF-2002, an item substitution on GRN-CAF-2003 where the delivered ingredient id differs from the ordered one, and a part return of 3 units on GRN-CAF-2004. accepted_quantity equals delivered_quantity minus returned_quantity on every row.
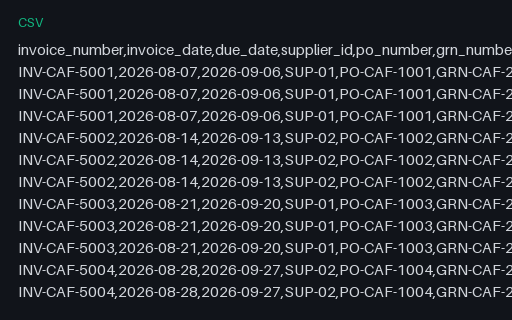
Supplier invoice lines CSV for Juniper Corner Cafe. 14 lines across 5 invoice documents that carry only 4 distinct invoice numbers: INV-CAF-5002 appears twice, dated 2026-08-14 and 2026-08-17. invoice_number is therefore not a key; the pair of invoice_number and invoice_date is. invoice_stated_tax_total is the figure printed on the document, which for INV-CAF-5003 is one cent above the sum of its line tax amounts.
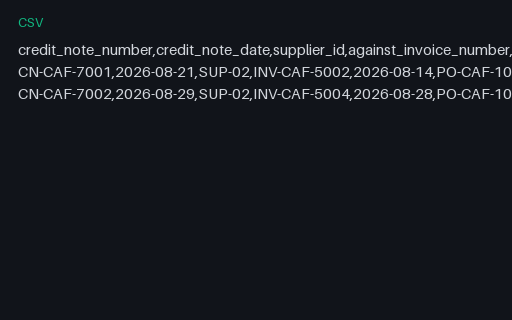
Credit note lines CSV for Juniper Corner Cafe. 2 credit lines, one per note. CN-CAF-7001 credits 4 units for the short delivery and agrees with the goods-received note. CN-CAF-7002 credits 5 units where GRN-CAF-2004 records only 3 returned, an overstatement of 3.04 CAD net.
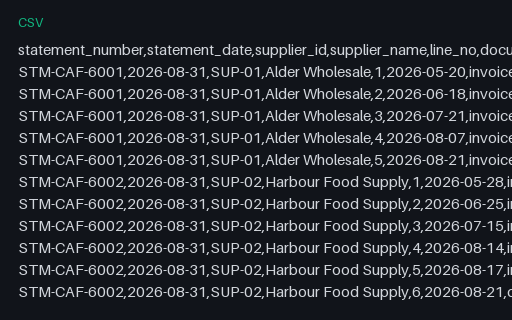
Statements of account CSV for Juniper Corner Cafe. 13 transaction rows across 2 month-end statements dated 2026-08-31. STM-CAF-6001 closes at 1726.12 CAD and its four declared ageing buckets sum to exactly that. STM-CAF-6002 closes at 1449.94 CAD while its declared buckets sum to 1460.86 CAD.
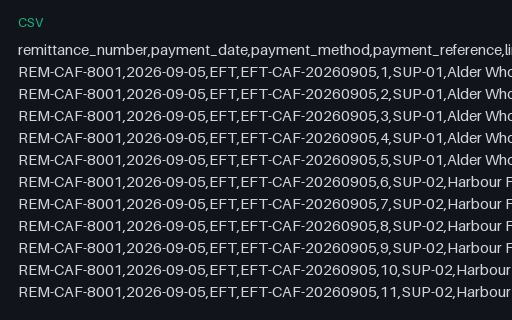
Remittance advice lines CSV for Juniper Corner Cafe. 13 lines, one for every document on both statements, each marked paid or withheld with a reason. 1235.99 CAD is settled and 1940.07 CAD is withheld against statement balances of 3176.06 CAD; the first two figures sum to the third.
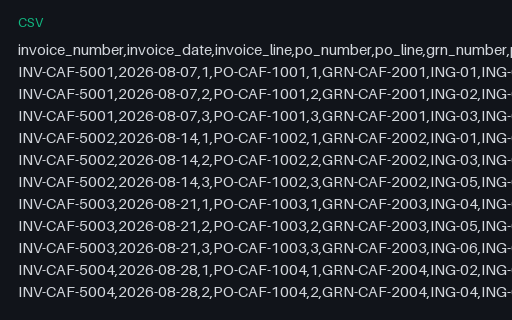
Three-way match report CSV for Juniper Corner Cafe. 14 rows joining every invoice line to its purchase order line and its goods-received line. 9 rows match on item, quantity and price; the remaining 5 carry a match_result of duplicate-invoice-number, item-substituted, matched-credit-expected, quantity-variance and a note giving the exact variance.
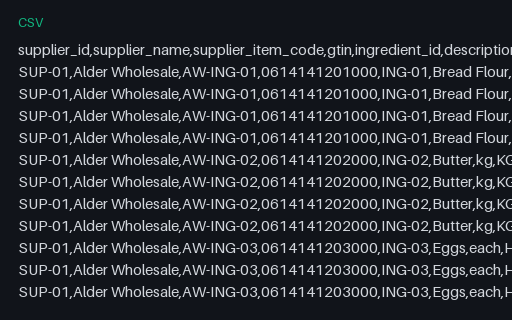
Supplier price list CSV for Copper Oven Bakery. 48 rows covering 2 suppliers, 6 items and 4 effective dates (2026-08-05, 2026-08-12, 2026-08-19, 2026-08-26). Each row carries the list unit price, the case pack quantity, the price per case and a contract tier price that applies only at 250 units. Every purchase order line in this set is priced from the row matching its supplier, item and order date.
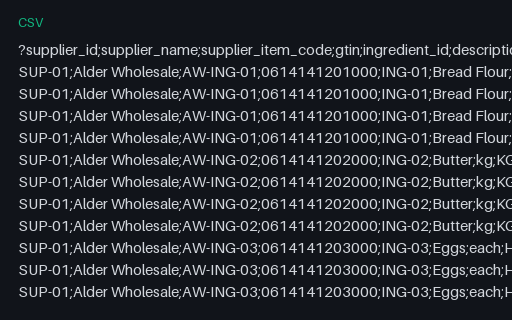
Supplier price list CSV, semicolon and decimal comma for Copper Oven Bakery. The same 48 price rows re-exported the way a European supplier portal writes them: UTF-8 with a byte-order mark (EF BB BF), semicolon field separators, CRLF line endings, and decimal commas in list_unit_price, price_per_case and contract_tier_unit_price. Column names, column order and every value are identical to price-list.csv; only the encoding and the separators differ.
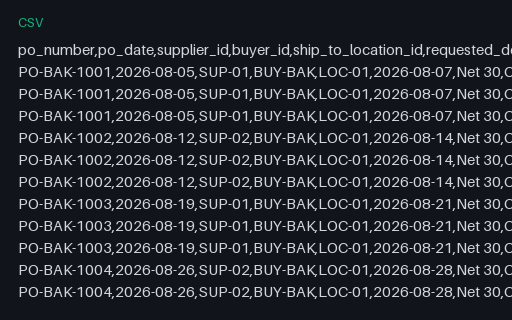
Purchase order lines CSV for Copper Oven Bakery. 12 lines across 4 purchase orders dated 2026-08-05 to 2026-08-26. Each line repeats its order's net, tax and gross totals, so a reader can check that the line values sum to the header without a second file. Order PO-BAK-1002 totals 289.65 CAD including GST.
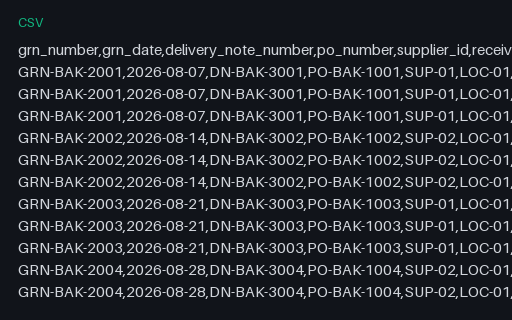
Goods-received note lines CSV for Copper Oven Bakery. 12 received lines across 4 goods-received notes. Three lines are exceptions: a short delivery of 4 units on GRN-BAK-2002, an item substitution on GRN-BAK-2003 where the delivered ingredient id differs from the ordered one, and a part return of 3 units on GRN-BAK-2004. accepted_quantity equals delivered_quantity minus returned_quantity on every row.
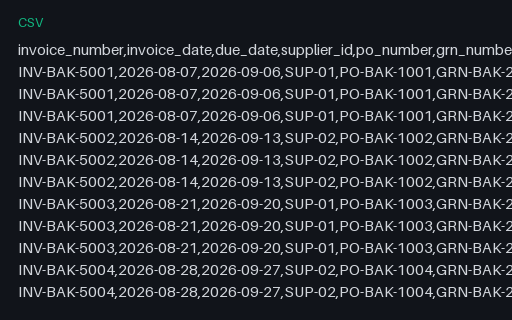
Supplier invoice lines CSV for Copper Oven Bakery. 14 lines across 5 invoice documents that carry only 4 distinct invoice numbers: INV-BAK-5002 appears twice, dated 2026-08-14 and 2026-08-17. invoice_number is therefore not a key; the pair of invoice_number and invoice_date is. invoice_stated_tax_total is the figure printed on the document, which for INV-BAK-5003 is one cent above the sum of its line tax amounts.
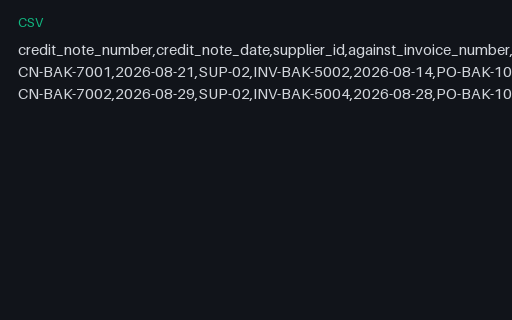
Credit note lines CSV for Copper Oven Bakery. 2 credit lines, one per note. CN-BAK-7001 credits 4 units for the short delivery and agrees with the goods-received note. CN-BAK-7002 credits 5 units where GRN-BAK-2004 records only 3 returned, an overstatement of 9.88 CAD net.
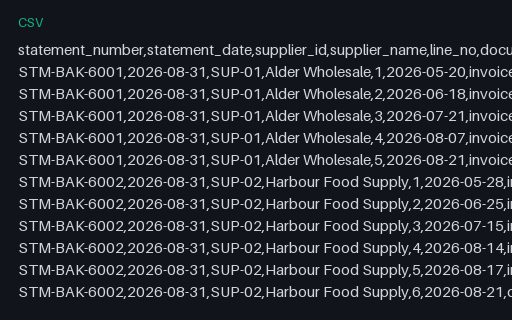
Statements of account CSV for Copper Oven Bakery. 13 transaction rows across 2 month-end statements dated 2026-08-31. STM-BAK-6001 closes at 740.74 CAD and its four declared ageing buckets sum to exactly that. STM-BAK-6002 closes at 1395.48 CAD while its declared buckets sum to 1396.87 CAD.
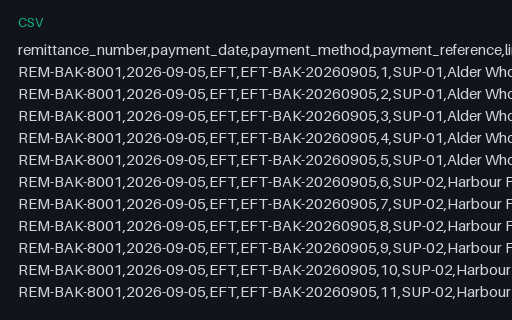
Remittance advice lines CSV for Copper Oven Bakery. 13 lines, one for every document on both statements, each marked paid or withheld with a reason. 946.62 CAD is settled and 1189.60 CAD is withheld against statement balances of 2136.22 CAD; the first two figures sum to the third.
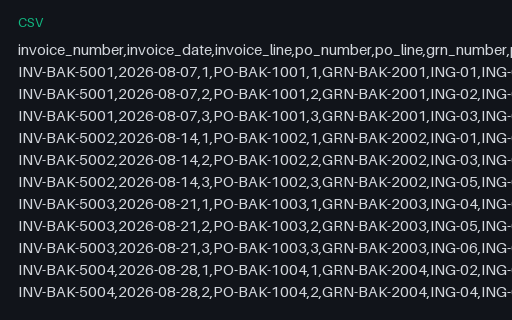
Three-way match report CSV for Copper Oven Bakery. 14 rows joining every invoice line to its purchase order line and its goods-received line. 9 rows match on item, quantity and price; the remaining 5 carry a match_result of duplicate-invoice-number, item-substituted, matched-credit-expected, quantity-variance and a note giving the exact variance.
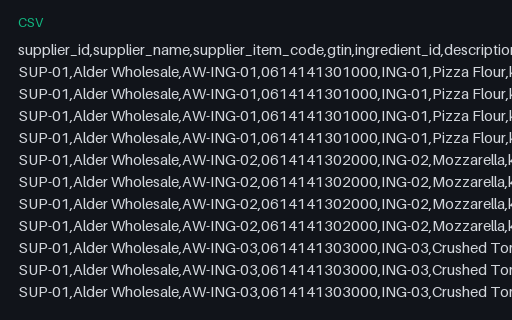
Supplier price list CSV for Ember Lane Pizza. 48 rows covering 2 suppliers, 6 items and 4 effective dates (2026-08-05, 2026-08-12, 2026-08-19, 2026-08-26). Each row carries the list unit price, the case pack quantity, the price per case and a contract tier price that applies only at 250 units. Every purchase order line in this set is priced from the row matching its supplier, item and order date.
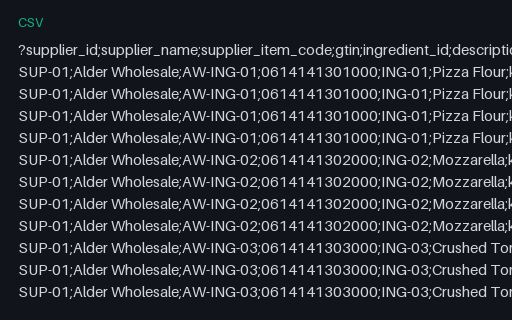
Supplier price list CSV, semicolon and decimal comma for Ember Lane Pizza. The same 48 price rows re-exported the way a European supplier portal writes them: UTF-8 with a byte-order mark (EF BB BF), semicolon field separators, CRLF line endings, and decimal commas in list_unit_price, price_per_case and contract_tier_unit_price. Column names, column order and every value are identical to price-list.csv; only the encoding and the separators differ.
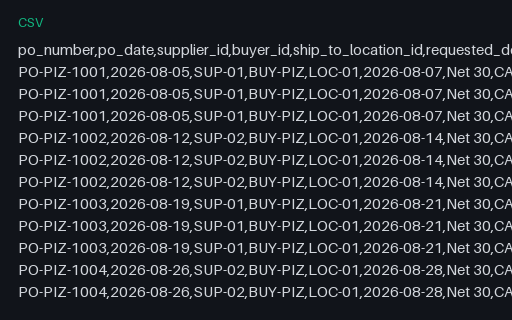
Purchase order lines CSV for Ember Lane Pizza. 12 lines across 4 purchase orders dated 2026-08-05 to 2026-08-26. Each line repeats its order's net, tax and gross totals, so a reader can check that the line values sum to the header without a second file. Order PO-PIZ-1002 totals 468.93 CAD including GST.
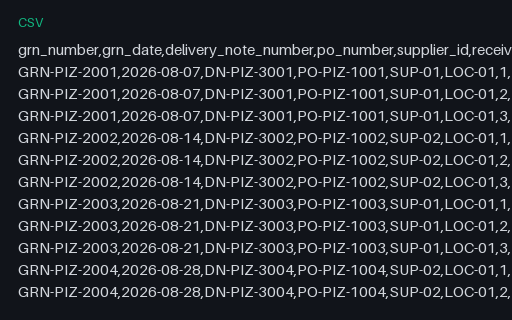
Goods-received note lines CSV for Ember Lane Pizza. 12 received lines across 4 goods-received notes. Three lines are exceptions: a short delivery of 4 units on GRN-PIZ-2002, an item substitution on GRN-PIZ-2003 where the delivered ingredient id differs from the ordered one, and a part return of 3 units on GRN-PIZ-2004. accepted_quantity equals delivered_quantity minus returned_quantity on every row.
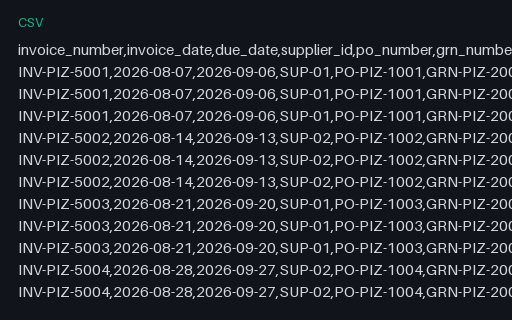
Supplier invoice lines CSV for Ember Lane Pizza. 14 lines across 5 invoice documents that carry only 4 distinct invoice numbers: INV-PIZ-5002 appears twice, dated 2026-08-14 and 2026-08-17. invoice_number is therefore not a key; the pair of invoice_number and invoice_date is. invoice_stated_tax_total is the figure printed on the document, which for INV-PIZ-5003 is one cent above the sum of its line tax amounts.
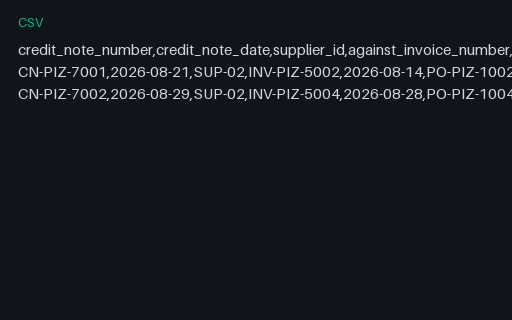
Credit note lines CSV for Ember Lane Pizza. 2 credit lines, one per note. CN-PIZ-7001 credits 4 units for the short delivery and agrees with the goods-received note. CN-PIZ-7002 credits 5 units where GRN-PIZ-2004 records only 3 returned, an overstatement of 1.04 CAD net.
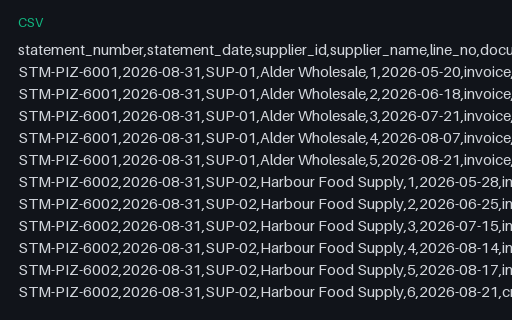
Statements of account CSV for Ember Lane Pizza. 13 transaction rows across 2 month-end statements dated 2026-08-31. STM-PIZ-6001 closes at 1107.20 CAD and its four declared ageing buckets sum to exactly that. STM-PIZ-6002 closes at 2166.98 CAD while its declared buckets sum to 2177.90 CAD.
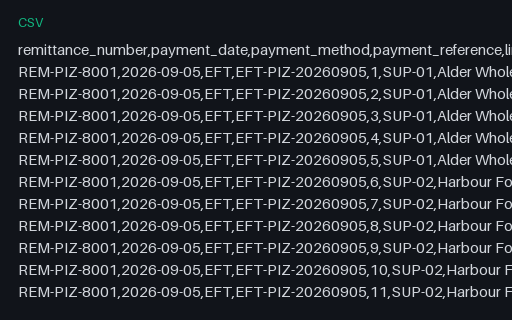
Remittance advice lines CSV for Ember Lane Pizza. 13 lines, one for every document on both statements, each marked paid or withheld with a reason. 1450.33 CAD is settled and 1823.85 CAD is withheld against statement balances of 3274.18 CAD; the first two figures sum to the third.
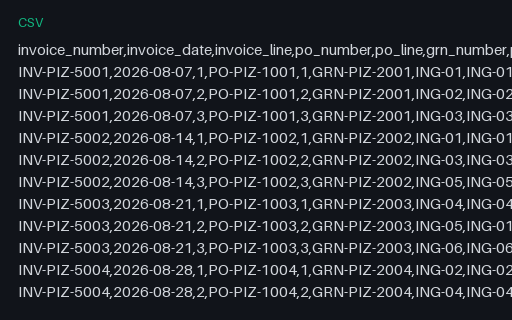
Three-way match report CSV for Ember Lane Pizza. 14 rows joining every invoice line to its purchase order line and its goods-received line. 9 rows match on item, quantity and price; the remaining 5 carry a match_result of duplicate-invoice-number, item-substituted, matched-credit-expected, quantity-variance and a note giving the exact variance.
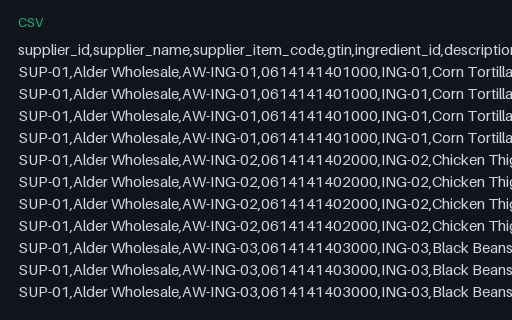
Supplier price list CSV for Cedar Street Tacos. 48 rows covering 2 suppliers, 6 items and 4 effective dates (2026-08-05, 2026-08-12, 2026-08-19, 2026-08-26). Each row carries the list unit price, the case pack quantity, the price per case and a contract tier price that applies only at 250 units. Every purchase order line in this set is priced from the row matching its supplier, item and order date.
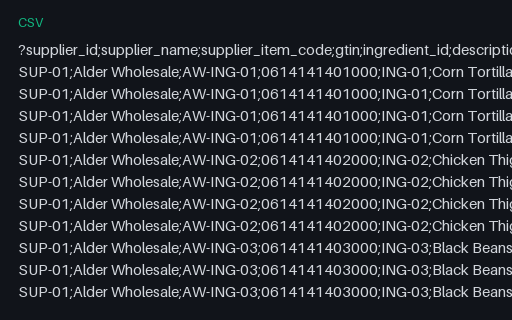
Supplier price list CSV, semicolon and decimal comma for Cedar Street Tacos. The same 48 price rows re-exported the way a European supplier portal writes them: UTF-8 with a byte-order mark (EF BB BF), semicolon field separators, CRLF line endings, and decimal commas in list_unit_price, price_per_case and contract_tier_unit_price. Column names, column order and every value are identical to price-list.csv; only the encoding and the separators differ.
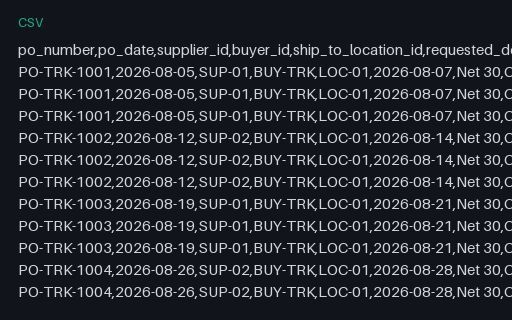
Purchase order lines CSV for Cedar Street Tacos. 12 lines across 4 purchase orders dated 2026-08-05 to 2026-08-26. Each line repeats its order's net, tax and gross totals, so a reader can check that the line values sum to the header without a second file. Order PO-TRK-1002 totals 104.33 CAD including GST.
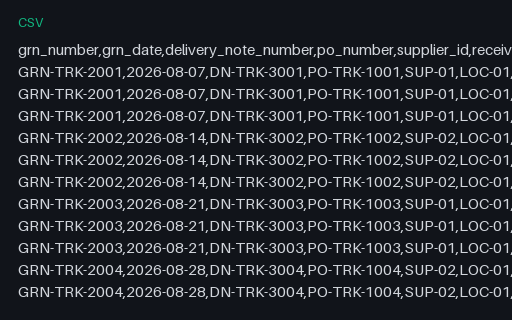
Goods-received note lines CSV for Cedar Street Tacos. 12 received lines across 4 goods-received notes. Three lines are exceptions: a short delivery of 4 units on GRN-TRK-2002, an item substitution on GRN-TRK-2003 where the delivered ingredient id differs from the ordered one, and a part return of 3 units on GRN-TRK-2004. accepted_quantity equals delivered_quantity minus returned_quantity on every row.
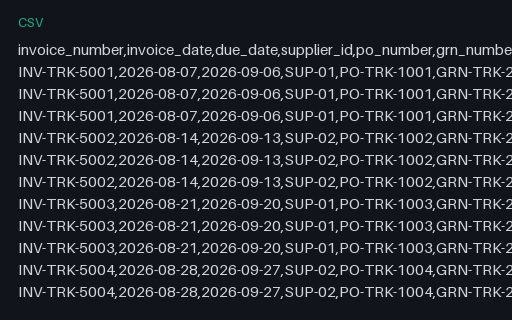
Supplier invoice lines CSV for Cedar Street Tacos. 14 lines across 5 invoice documents that carry only 4 distinct invoice numbers: INV-TRK-5002 appears twice, dated 2026-08-14 and 2026-08-17. invoice_number is therefore not a key; the pair of invoice_number and invoice_date is. invoice_stated_tax_total is the figure printed on the document, which for INV-TRK-5003 is one cent above the sum of its line tax amounts.
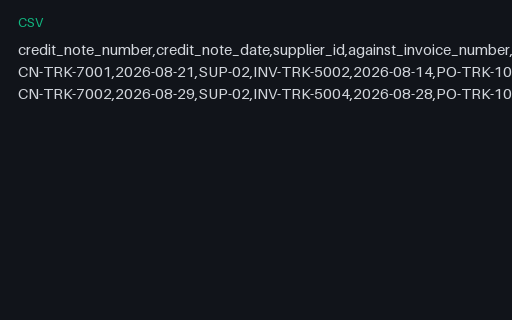
Credit note lines CSV for Cedar Street Tacos. 2 credit lines, one per note. CN-TRK-7001 credits 4 units for the short delivery and agrees with the goods-received note. CN-TRK-7002 credits 5 units where GRN-TRK-2004 records only 3 returned, an overstatement of 0.42 CAD net.
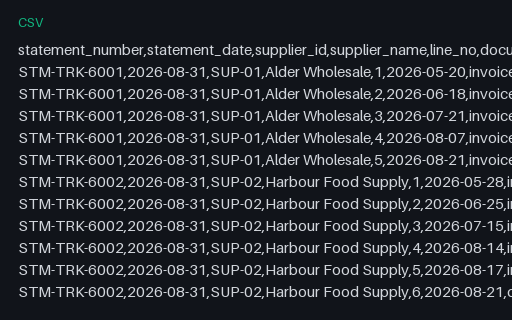
Statements of account CSV for Cedar Street Tacos. 13 transaction rows across 2 month-end statements dated 2026-08-31. STM-TRK-6001 closes at 547.74 CAD and its four declared ageing buckets sum to exactly that. STM-TRK-6002 closes at 472.24 CAD while its declared buckets sum to 481.61 CAD.
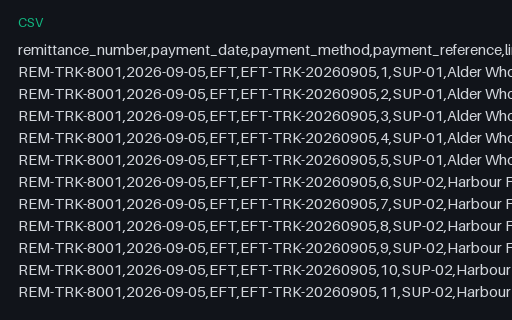
Remittance advice lines CSV for Cedar Street Tacos. 13 lines, one for every document on both statements, each marked paid or withheld with a reason. 635.20 CAD is settled and 384.78 CAD is withheld against statement balances of 1019.98 CAD; the first two figures sum to the third.
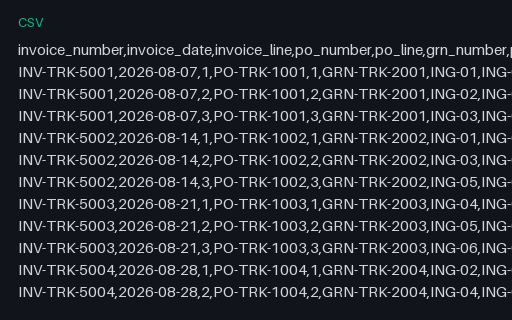
Three-way match report CSV for Cedar Street Tacos. 14 rows joining every invoice line to its purchase order line and its goods-received line. 9 rows match on item, quantity and price; the remaining 5 carry a match_result of duplicate-invoice-number, item-substituted, matched-credit-expected, quantity-variance and a note giving the exact variance.
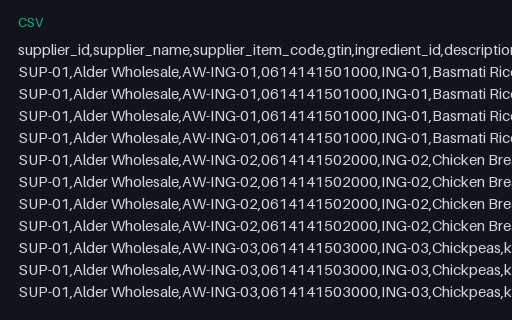
Supplier price list CSV for Willow Event Kitchen. 48 rows covering 2 suppliers, 6 items and 4 effective dates (2026-08-05, 2026-08-12, 2026-08-19, 2026-08-26). Each row carries the list unit price, the case pack quantity, the price per case and a contract tier price that applies only at 250 units. Every purchase order line in this set is priced from the row matching its supplier, item and order date.
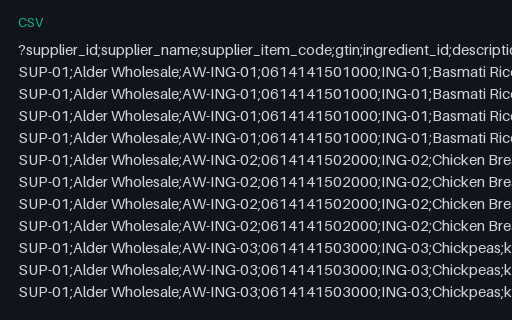
Supplier price list CSV, semicolon and decimal comma for Willow Event Kitchen. The same 48 price rows re-exported the way a European supplier portal writes them: UTF-8 with a byte-order mark (EF BB BF), semicolon field separators, CRLF line endings, and decimal commas in list_unit_price, price_per_case and contract_tier_unit_price. Column names, column order and every value are identical to price-list.csv; only the encoding and the separators differ.
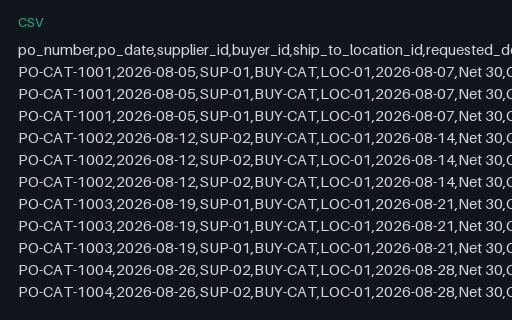
Purchase order lines CSV for Willow Event Kitchen. 12 lines across 4 purchase orders dated 2026-08-05 to 2026-08-26. Each line repeats its order's net, tax and gross totals, so a reader can check that the line values sum to the header without a second file. Order PO-CAT-1002 totals 208.13 CAD including GST.
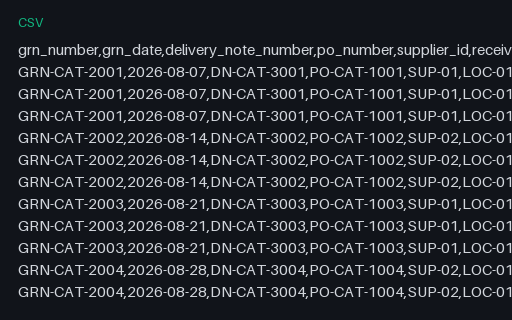
Goods-received note lines CSV for Willow Event Kitchen. 12 received lines across 4 goods-received notes. Three lines are exceptions: a short delivery of 4 units on GRN-CAT-2002, an item substitution on GRN-CAT-2003 where the delivered ingredient id differs from the ordered one, and a part return of 3 units on GRN-CAT-2004. accepted_quantity equals delivered_quantity minus returned_quantity on every row.
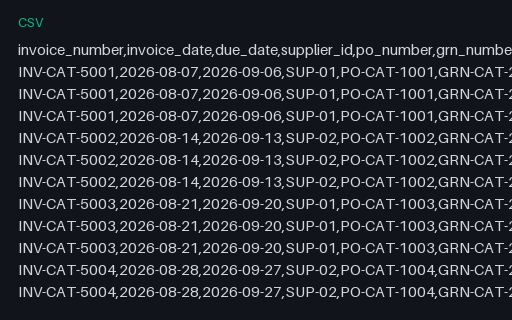
Supplier invoice lines CSV for Willow Event Kitchen. 14 lines across 5 invoice documents that carry only 4 distinct invoice numbers: INV-CAT-5002 appears twice, dated 2026-08-14 and 2026-08-17. invoice_number is therefore not a key; the pair of invoice_number and invoice_date is. invoice_stated_tax_total is the figure printed on the document, which for INV-CAT-5003 is one cent above the sum of its line tax amounts.
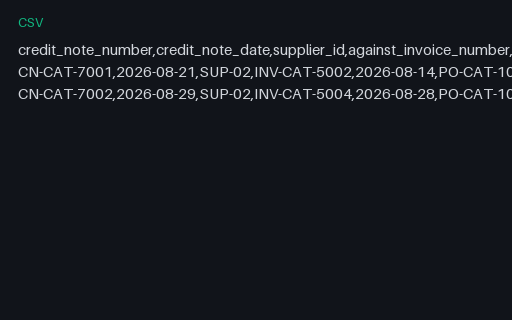
Credit note lines CSV for Willow Event Kitchen. 2 credit lines, one per note. CN-CAT-7001 credits 4 units for the short delivery and agrees with the goods-received note. CN-CAT-7002 credits 5 units where GRN-CAT-2004 records only 3 returned, an overstatement of 2.28 CAD net.
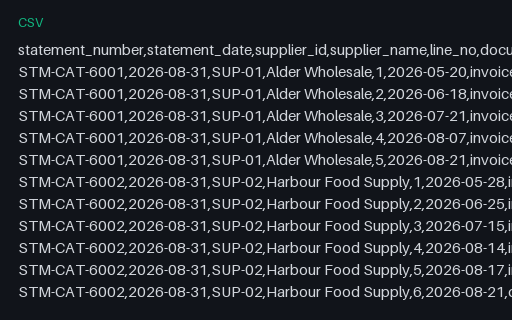
Statements of account CSV for Willow Event Kitchen. 13 transaction rows across 2 month-end statements dated 2026-08-31. STM-CAT-6001 closes at 1003.36 CAD and its four declared ageing buckets sum to exactly that. STM-CAT-6002 closes at 981.44 CAD while its declared buckets sum to 991.60 CAD.
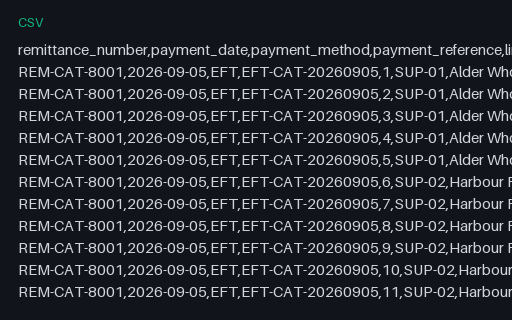
Remittance advice lines CSV for Willow Event Kitchen. 13 lines, one for every document on both statements, each marked paid or withheld with a reason. 1088.50 CAD is settled and 896.30 CAD is withheld against statement balances of 1984.80 CAD; the first two figures sum to the third.
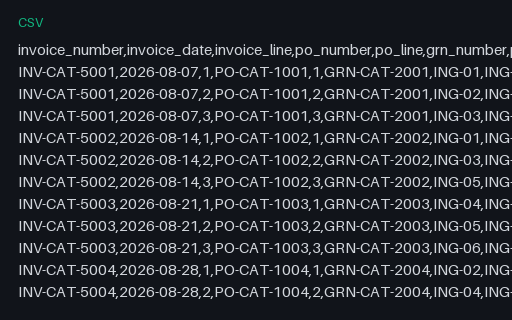
Three-way match report CSV for Willow Event Kitchen. 14 rows joining every invoice line to its purchase order line and its goods-received line. 9 rows match on item, quantity and price; the remaining 5 carry a match_result of duplicate-invoice-number, item-substituted, matched-credit-expected, quantity-variance and a note giving the exact variance.
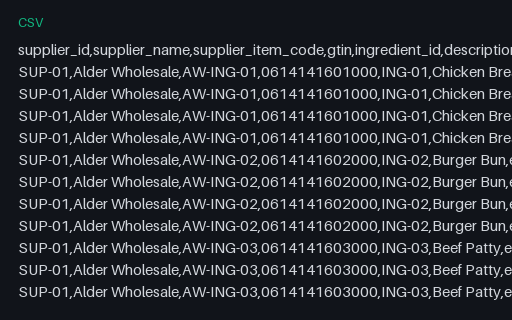
Supplier price list CSV for Harbour Kitchen Group. 48 rows covering 2 suppliers, 6 items and 4 effective dates (2026-08-05, 2026-08-12, 2026-08-19, 2026-08-26). Each row carries the list unit price, the case pack quantity, the price per case and a contract tier price that applies only at 250 units. Every purchase order line in this set is priced from the row matching its supplier, item and order date.
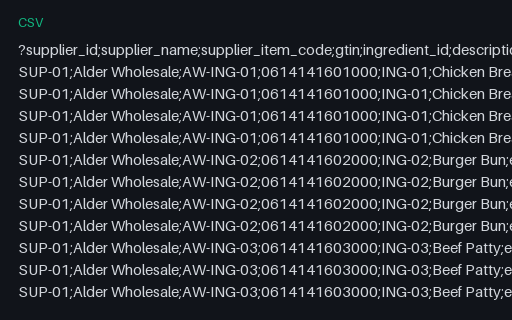
Supplier price list CSV, semicolon and decimal comma for Harbour Kitchen Group. The same 48 price rows re-exported the way a European supplier portal writes them: UTF-8 with a byte-order mark (EF BB BF), semicolon field separators, CRLF line endings, and decimal commas in list_unit_price, price_per_case and contract_tier_unit_price. Column names, column order and every value are identical to price-list.csv; only the encoding and the separators differ.
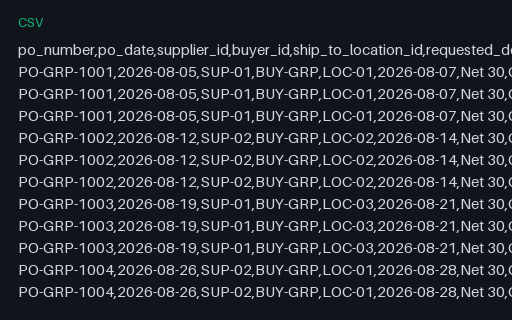
Purchase order lines CSV for Harbour Kitchen Group. 12 lines across 4 purchase orders dated 2026-08-05 to 2026-08-26. Each line repeats its order's net, tax and gross totals, so a reader can check that the line values sum to the header without a second file. Order PO-GRP-1002 totals 325.41 CAD including GST.
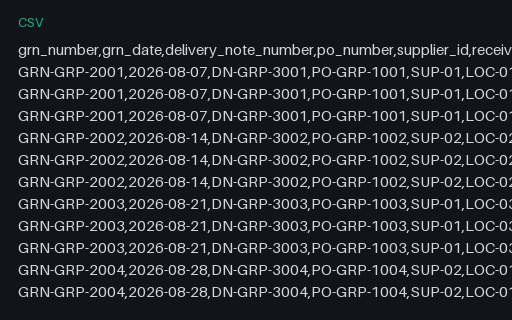
Goods-received note lines CSV for Harbour Kitchen Group. 12 received lines across 4 goods-received notes. Three lines are exceptions: a short delivery of 4 units on GRN-GRP-2002, an item substitution on GRN-GRP-2003 where the delivered ingredient id differs from the ordered one, and a part return of 3 units on GRN-GRP-2004. accepted_quantity equals delivered_quantity minus returned_quantity on every row.
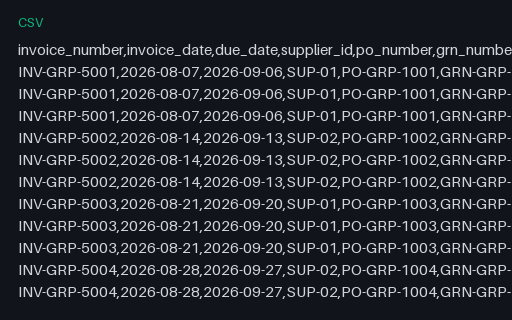
Supplier invoice lines CSV for Harbour Kitchen Group. 14 lines across 5 invoice documents that carry only 4 distinct invoice numbers: INV-GRP-5002 appears twice, dated 2026-08-14 and 2026-08-17. invoice_number is therefore not a key; the pair of invoice_number and invoice_date is. invoice_stated_tax_total is the figure printed on the document, which for INV-GRP-5003 is one cent above the sum of its line tax amounts.
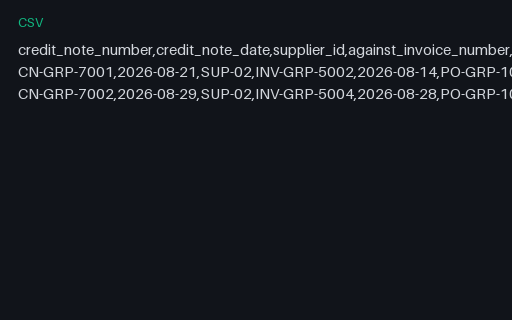
Credit note lines CSV for Harbour Kitchen Group. 2 credit lines, one per note. CN-GRP-7001 credits 4 units for the short delivery and agrees with the goods-received note. CN-GRP-7002 credits 5 units where GRN-GRP-2004 records only 3 returned, an overstatement of 3.80 CAD net.
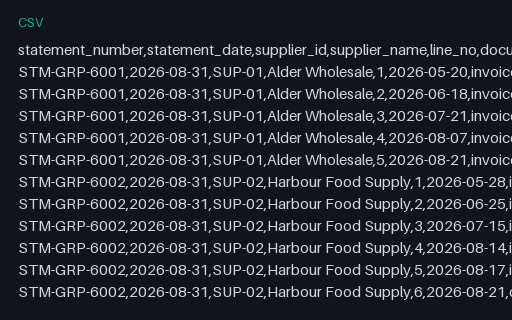
Statements of account CSV for Harbour Kitchen Group. 13 transaction rows across 2 month-end statements dated 2026-08-31. STM-GRP-6001 closes at 1317.12 CAD and its four declared ageing buckets sum to exactly that. STM-GRP-6002 closes at 1333.12 CAD while its declared buckets sum to 1342.11 CAD.
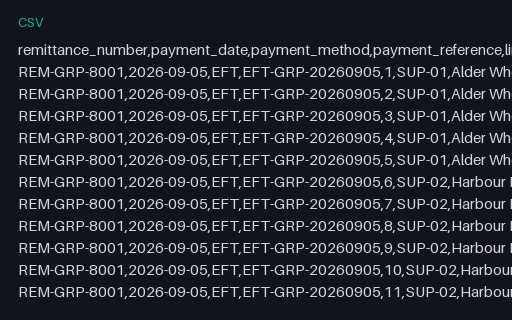
Remittance advice lines CSV for Harbour Kitchen Group. 13 lines, one for every document on both statements, each marked paid or withheld with a reason. 1041.96 CAD is settled and 1608.28 CAD is withheld against statement balances of 2650.24 CAD; the first two figures sum to the third.
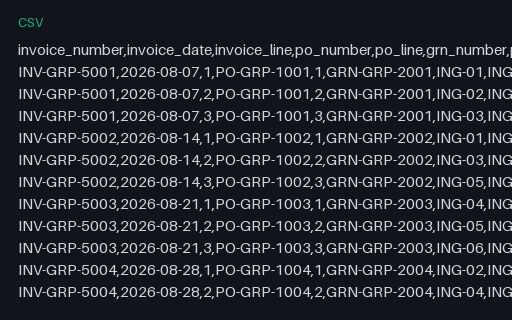
Three-way match report CSV for Harbour Kitchen Group. 14 rows joining every invoice line to its purchase order line and its goods-received line. 9 rows match on item, quantity and price; the remaining 5 carry a match_result of duplicate-invoice-number, item-substituted, matched-credit-expected, quantity-variance and a note giving the exact variance.
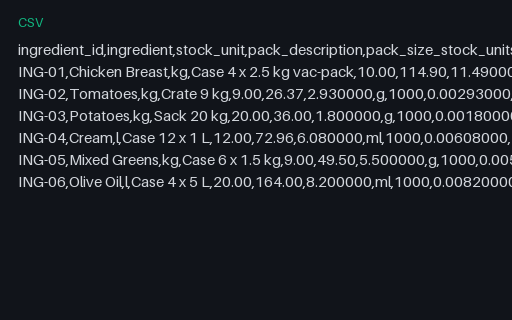
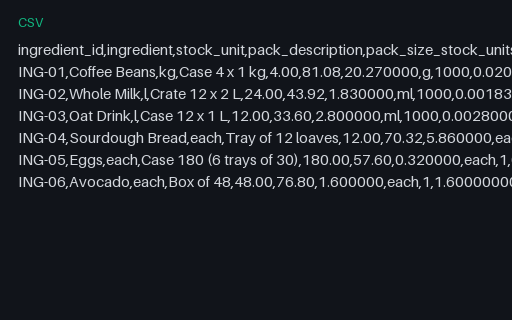
Purchase pack to recipe unit conversions for Alder Table Bistro. 6 ingredients across 16 columns. Each row carries the purchase pack, the pack price, the cost per stock unit to six decimal places, the cost per recipe unit to eight, and the purchase id, date and supplier the price came from. 0 row(s) report a non-zero rounding residual because the pack size is not a whole number of stock units.
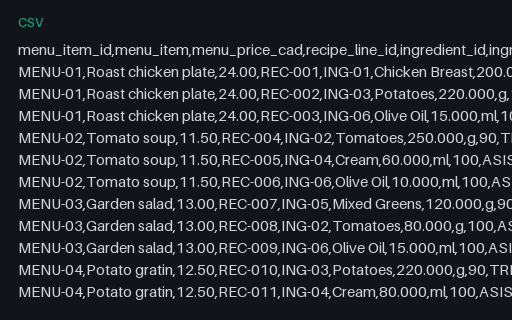
Plate costing lines for Alder Table Bistro. 12 recipe lines across 4 menu items, 17 columns. Recipe quantities are in grams, millilitres or each; the as-purchased quantity divides by the yield, so the line cost is not a naive multiplication. Plate costs run 1.01 to 3.07 CAD.
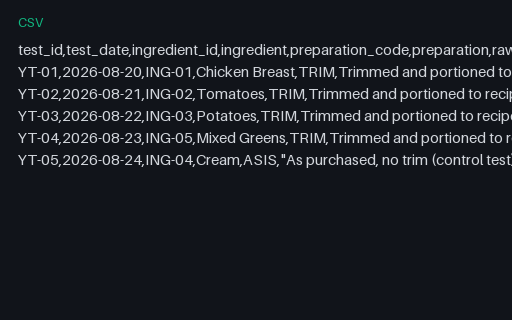
Yield test results for Alder Table Bistro. 5 yield tests across 17 columns: raw weight, trim waste, trimmed weight, trim yield percent, cooked weight, cooking loss percent and the overall yield factor. All 5 rows report matches_recipe=yes, meaning each measured trim yield equals the yield percent that plate-costs.csv applies to the same ingredient.
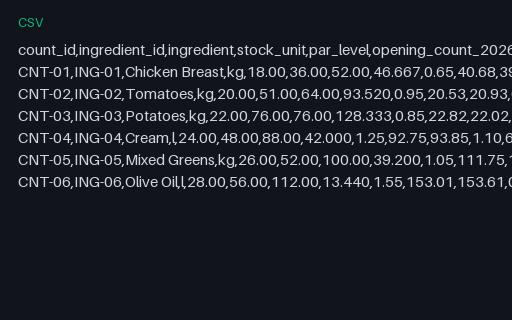
Inventory count sheet for Alder Table Bistro. 6 ingredients across 17 columns: par level, opening count, receipts, theoretical usage, recorded waste, theoretical closing, counted closing and the variance between them, priced at standard cost. 0 item(s) close below par. These counted closing quantities are the ones cogs-report-inconsistent.csv contradicts.
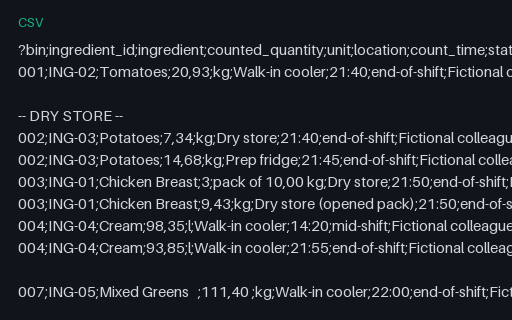
Inventory count sheet as transcribed for Alder Table Bistro. The same closing counts as inventory-count-sheet.csv, in the shape a paper count actually arrives in. CRLF line endings, a UTF-8 byte order mark, a semicolon delimiter and a decimal comma. Two blank lines, one section banner that is not a record, one ingredient split across two locations, one counted as whole packs plus a remainder, one superseded mid-shift row at 14:20, trailing whitespace in three fields, a leading-zero bin code, an empty bin code, and one record carrying ten fields where the header declares 9. Every quirk is named in README.md.
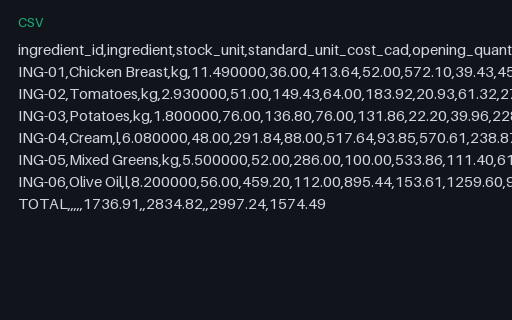
Cost of goods sold that contradicts the count sheet for Alder Table Bistro. Intentionally inconsistent. Row 3 reports a closing count of 22.20 kg for ING-03 (Potatoes), the counted figure with the two decimal digits transposed, where inventory-count-sheet.csv, inventory-variance.xlsx and cogs-report.json all count 22.02 kg. Every derived value follows the wrong count, so the file is internally consistent and its total of 1574.49 CAD differs from the correct 1574.81 CAD by -0.32 CAD.
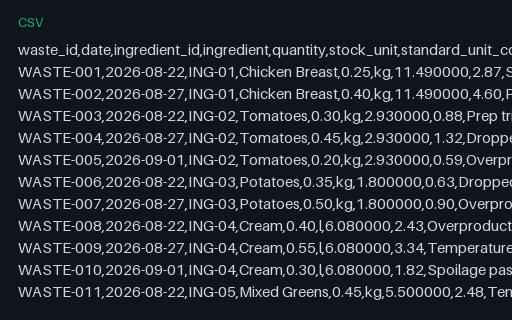
Waste and spoilage log for Alder Table Bistro. 15 dated waste entries across 11 columns, totalling 37.87 CAD at standard cost. The quantities per ingredient are exactly the recorded waste that inventory-variance.xlsx and cogs-report.xlsx deduct.
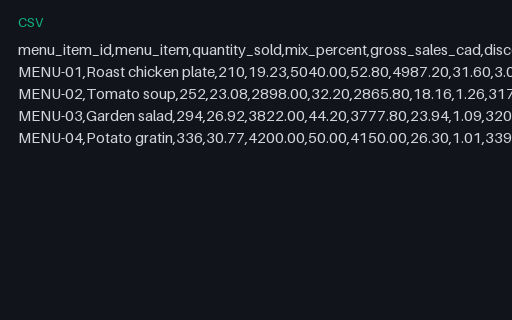
Product mix report for Alder Table Bistro. 4 menu items across 12 columns for 2026-08-20 to 2026-09-02: quantity sold, mix percent, gross, discount, net, share of net, plate cost, item cost, item margin and item food-cost percent. Quantities and net sales match the shared sales table row for row; total net is 15780.80 CAD.
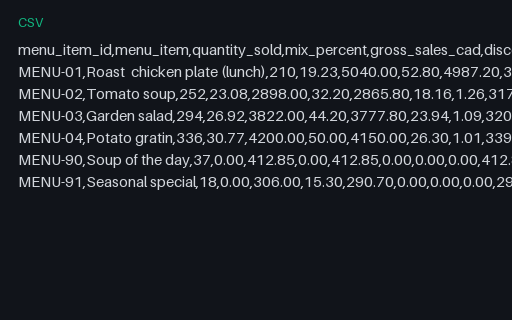
Product mix carrying items the menu does not have for Alder Table Bistro. Intentionally inconsistent. 6 rows where sales-mix-pmix.csv has 4. MENU-90 and MENU-91 are not in the shared menu table, and the first row renames MENU-01 to "Roast chicken plate (lunch)", which has a doubled space and a suffix the menu does not carry. The remaining rows are correct.
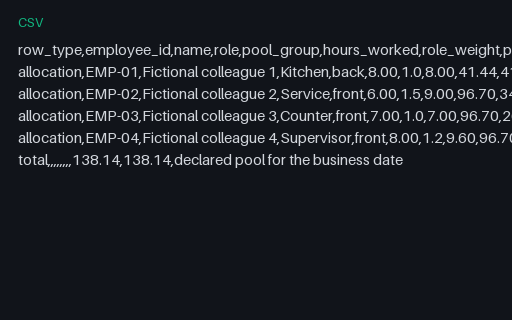
Tip pool distribution for Alder Table Bistro. 4 allocation rows and one total row for 2026-08-28. The declared pool of 138.14 CAD is 95.39 charged to card plus 42.75 declared cash, split 30 percent to back of house, then allocated within each group by hours times a role weight. Whole cents are assigned by largest remainder, so the rows sum to 138.14 CAD, which equals the pool exactly.
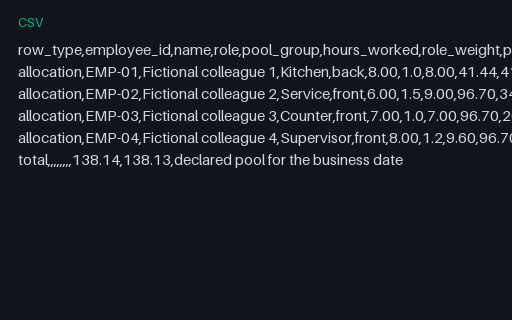
Tip pool that is one cent short for Alder Table Bistro. Intentionally inconsistent. The last allocation row (EMP-04) reads 36.25 where the exact largest-remainder share is 36.26. The allocation rows therefore sum to 138.13 CAD while the total row still declares the pool as 138.14 CAD, a shortfall of exactly 0.01 CAD.
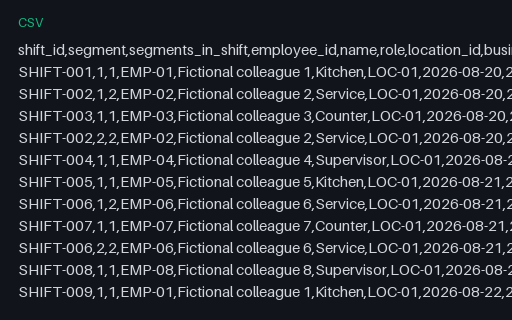
Labour schedule with split and overnight shifts for Alder Table Bistro. 74 shift segments across 17 columns for 2026-08-20 to 2026-09-02, totalling 413.00 paid hours and 9634.00 CAD of base pay. 14 shifts are split into two segments with an unpaid gap, and 9 segments end on the following calendar day, including SHIFT-056 which runs 22:30 on 2026-09-02 to 05:30 on 2026-09-03. 4 rows are authored cover shifts; the rest reproduce the shared staffing table hour for hour.
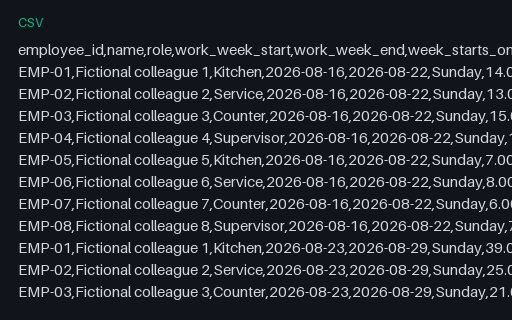
Overtime computed on the wrong week boundary for Alder Table Bistro. Intentionally inconsistent. The same 74 shift segments are grouped into Sunday-start work weeks where the declared policy, and labour-hours-overtime.xlsx, start each week on Monday. The correct grouping yields 5.00 payable overtime hours and 51.50 CAD of premium; this file yields 3.00 hours and 31.50 CAD. The hours that disappear belong to EMP-01 in the week beginning 2026-08-24, whose 46.00 hours the Sunday grouping splits across two weeks.
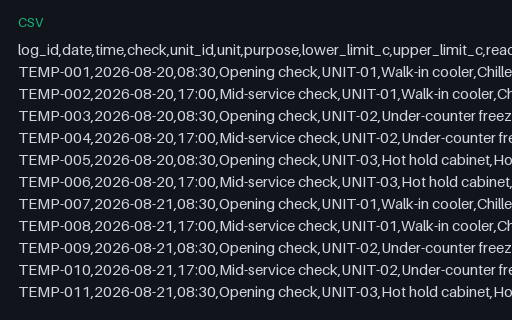
HACCP temperature log for Alder Table Bistro. 84 readings across 13 columns: 3 units checked twice a day for fourteen days. Each row carries its own lower and upper limit, so the within_limit column can be recomputed from the row beside it. 2 readings fall outside their limit (TEMP-038, TEMP-071) and only those rows carry a corrective action.
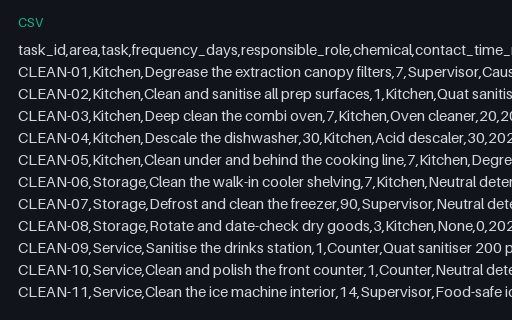
Cleaning schedule for Alder Table Bistro. 18 tasks across 6 areas and 11 columns, with frequency in days, the responsible role, the chemical and its contact time, the last completion date and a next-due date that is exactly last_completed plus frequency_days. 4 task(s) are overdue at the period end.
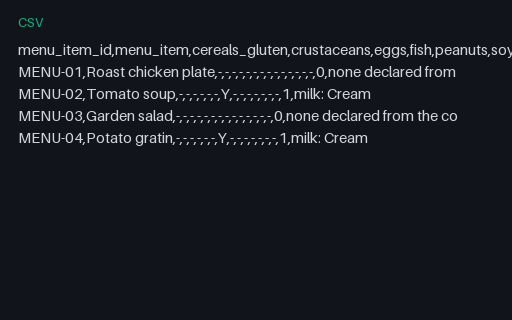
Allergen matrix for Alder Table Bistro. 4 menu items across 18 columns: the fourteen listed allergens plus a count and a sources column naming the ingredient behind every Y. Derived from the recipe lines, so a dish whose recipe contains a dairy ingredient reads Y under milk. 2 of 4 dishes declare at least one allergen.
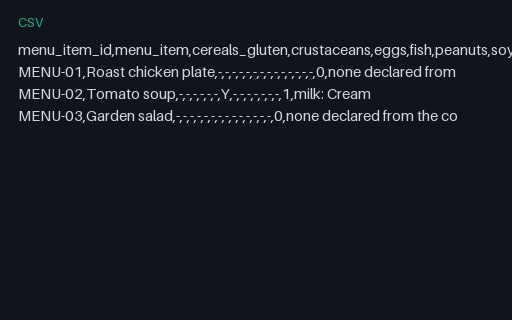
Allergen matrix missing a menu item for Alder Table Bistro. Intentionally incomplete. 3 rows where the recipes cost 4 menu items. MENU-04 (Potato gratin) has no row, although it has costed recipe lines in plate-costs.csv and sales in sales-mix-pmix.csv. Its correct row would declare: milk: Cream.
Purchase pack to recipe unit conversions for Juniper Corner Cafe. 6 ingredients across 16 columns. Each row carries the purchase pack, the pack price, the cost per stock unit to six decimal places, the cost per recipe unit to eight, and the purchase id, date and supplier the price came from. 0 row(s) report a non-zero rounding residual because the pack size is not a whole number of stock units.
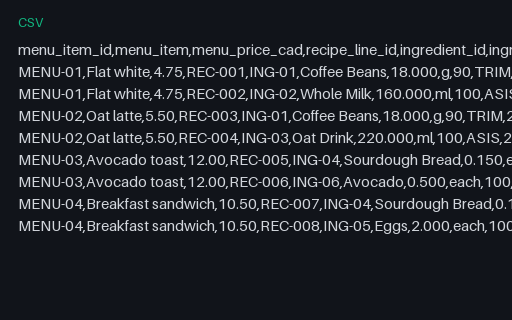
Plate costing lines for Juniper Corner Cafe. 8 recipe lines across 4 menu items, 17 columns. Recipe quantities are in grams, millilitres or each; the as-purchased quantity divides by the yield, so the line cost is not a naive multiplication. Plate costs run 0.70 to 1.68 CAD.
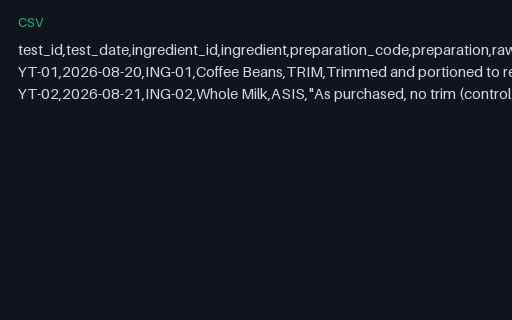
Yield test results for Juniper Corner Cafe. 2 yield tests across 17 columns: raw weight, trim waste, trimmed weight, trim yield percent, cooked weight, cooking loss percent and the overall yield factor. All 2 rows report matches_recipe=yes, meaning each measured trim yield equals the yield percent that plate-costs.csv applies to the same ingredient.
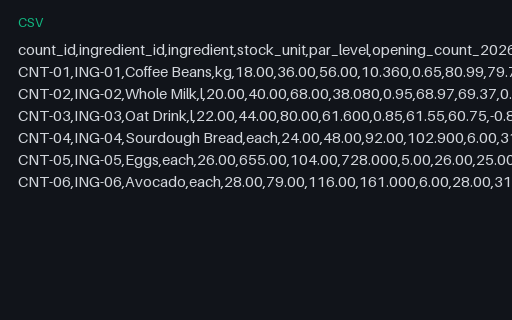
Inventory count sheet for Juniper Corner Cafe. 6 ingredients across 17 columns: par level, opening count, receipts, theoretical usage, recorded waste, theoretical closing, counted closing and the variance between them, priced at standard cost. 1 item(s) close below par. These counted closing quantities are the ones cogs-report-inconsistent.csv contradicts.
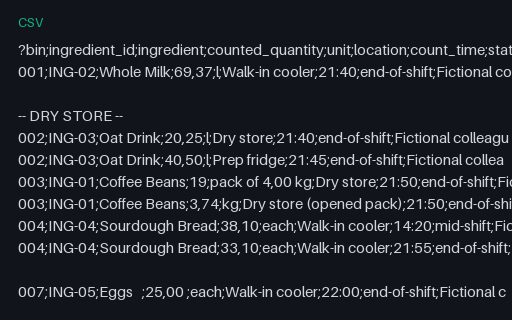
Inventory count sheet as transcribed for Juniper Corner Cafe. The same closing counts as inventory-count-sheet.csv, in the shape a paper count actually arrives in. CRLF line endings, a UTF-8 byte order mark, a semicolon delimiter and a decimal comma. Two blank lines, one section banner that is not a record, one ingredient split across two locations, one counted as whole packs plus a remainder, one superseded mid-shift row at 14:20, trailing whitespace in three fields, a leading-zero bin code, an empty bin code, and one record carrying ten fields where the header declares 9. Every quirk is named in README.md.
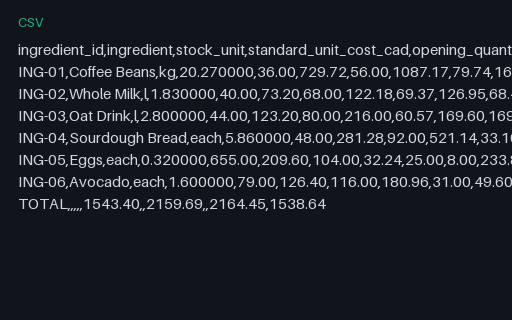
Cost of goods sold that contradicts the count sheet for Juniper Corner Cafe. Intentionally inconsistent. Row 3 reports a closing count of 60.57 l for ING-03 (Oat Drink), the counted figure with the two decimal digits transposed, where inventory-count-sheet.csv, inventory-variance.xlsx and cogs-report.json all count 60.75 l. Every derived value follows the wrong count, so the file is internally consistent and its total of 1538.64 CAD differs from the correct 1538.14 CAD by 0.50 CAD.
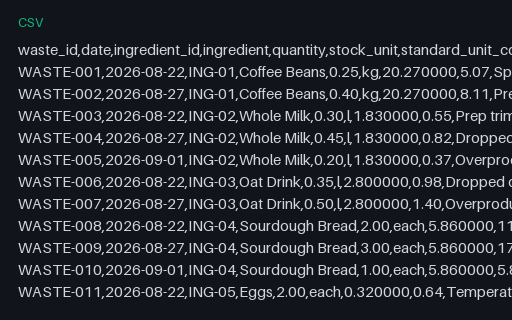
Waste and spoilage log for Juniper Corner Cafe. 15 dated waste entries across 11 columns, totalling 63.66 CAD at standard cost. The quantities per ingredient are exactly the recorded waste that inventory-variance.xlsx and cogs-report.xlsx deduct.
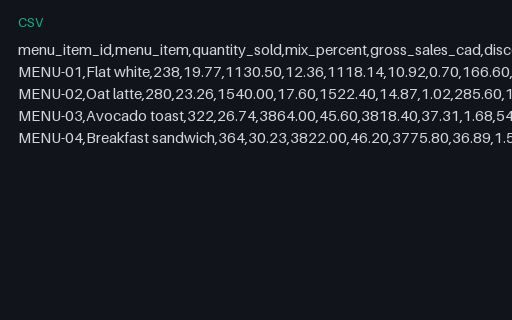
Product mix report for Juniper Corner Cafe. 4 menu items across 12 columns for 2026-08-20 to 2026-09-02: quantity sold, mix percent, gross, discount, net, share of net, plate cost, item cost, item margin and item food-cost percent. Quantities and net sales match the shared sales table row for row; total net is 10234.74 CAD.
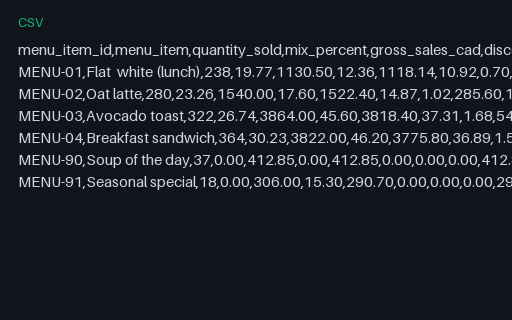
Product mix carrying items the menu does not have for Juniper Corner Cafe. Intentionally inconsistent. 6 rows where sales-mix-pmix.csv has 4. MENU-90 and MENU-91 are not in the shared menu table, and the first row renames MENU-01 to "Flat white (lunch)", which has a doubled space and a suffix the menu does not carry. The remaining rows are correct.
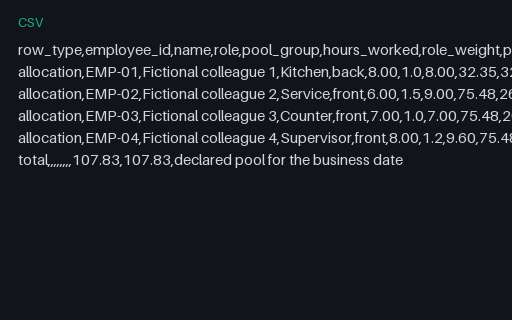
Tip pool distribution for Juniper Corner Cafe. 4 allocation rows and one total row for 2026-08-28. The declared pool of 107.83 CAD is 65.08 charged to card plus 42.75 declared cash, split 30 percent to back of house, then allocated within each group by hours times a role weight. Whole cents are assigned by largest remainder, so the rows sum to 107.83 CAD, which equals the pool exactly.
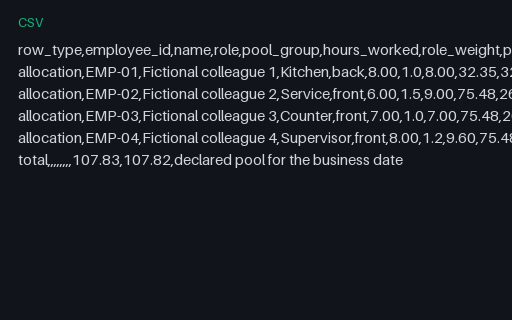
Tip pool that is one cent short for Juniper Corner Cafe. Intentionally inconsistent. The last allocation row (EMP-04) reads 28.29 where the exact largest-remainder share is 28.30. The allocation rows therefore sum to 107.82 CAD while the total row still declares the pool as 107.83 CAD, a shortfall of exactly 0.01 CAD.
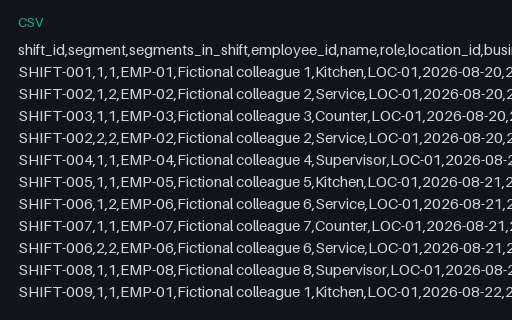
Labour schedule with split and overnight shifts for Juniper Corner Cafe. 74 shift segments across 17 columns for 2026-08-20 to 2026-09-02, totalling 413.00 paid hours and 9634.00 CAD of base pay. 14 shifts are split into two segments with an unpaid gap, and 9 segments end on the following calendar day, including SHIFT-056 which runs 22:30 on 2026-09-02 to 05:30 on 2026-09-03. 4 rows are authored cover shifts; the rest reproduce the shared staffing table hour for hour.
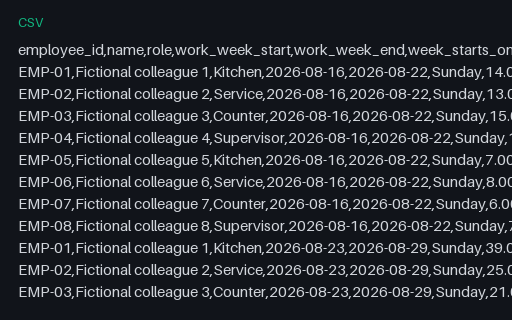
Overtime computed on the wrong week boundary for Juniper Corner Cafe. Intentionally inconsistent. The same 74 shift segments are grouped into Sunday-start work weeks where the declared policy, and labour-hours-overtime.xlsx, start each week on Monday. The correct grouping yields 5.00 payable overtime hours and 51.50 CAD of premium; this file yields 3.00 hours and 31.50 CAD. The hours that disappear belong to EMP-01 in the week beginning 2026-08-24, whose 46.00 hours the Sunday grouping splits across two weeks.
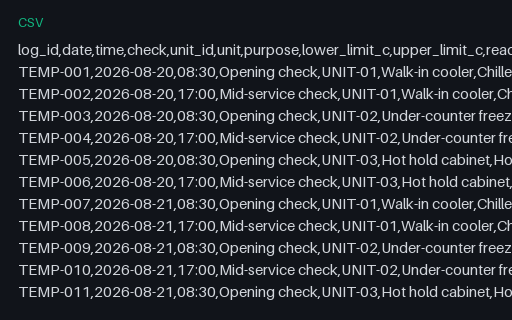
HACCP temperature log for Juniper Corner Cafe. 84 readings across 13 columns: 3 units checked twice a day for fourteen days. Each row carries its own lower and upper limit, so the within_limit column can be recomputed from the row beside it. 2 readings fall outside their limit (TEMP-038, TEMP-071) and only those rows carry a corrective action.
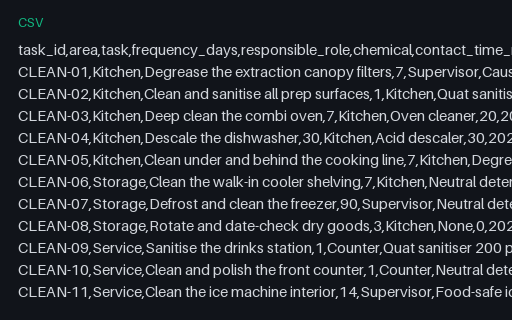
Cleaning schedule for Juniper Corner Cafe. 18 tasks across 6 areas and 11 columns, with frequency in days, the responsible role, the chemical and its contact time, the last completion date and a next-due date that is exactly last_completed plus frequency_days. 4 task(s) are overdue at the period end.
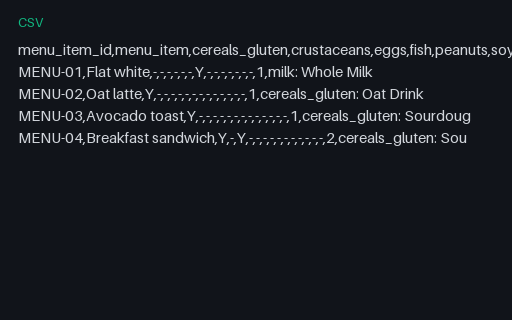
Allergen matrix for Juniper Corner Cafe. 4 menu items across 18 columns: the fourteen listed allergens plus a count and a sources column naming the ingredient behind every Y. Derived from the recipe lines, so a dish whose recipe contains a dairy ingredient reads Y under milk. 4 of 4 dishes declare at least one allergen.
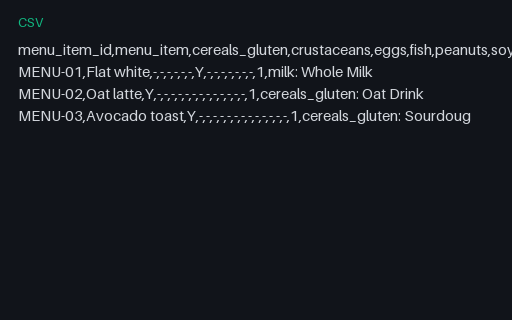
Allergen matrix missing a menu item for Juniper Corner Cafe. Intentionally incomplete. 3 rows where the recipes cost 4 menu items. MENU-04 (Breakfast sandwich) has no row, although it has costed recipe lines in plate-costs.csv and sales in sales-mix-pmix.csv. Its correct row would declare: cereals_gluten: Sourdough Bread; eggs: Eggs.
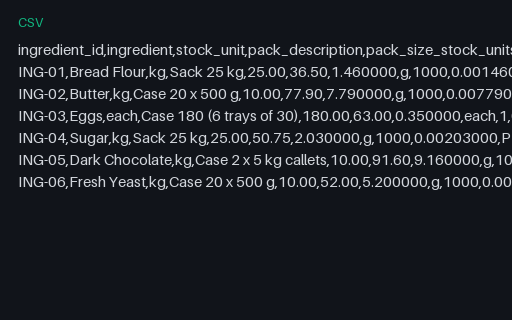
Purchase pack to recipe unit conversions for Copper Oven Bakery. 6 ingredients across 16 columns. Each row carries the purchase pack, the pack price, the cost per stock unit to six decimal places, the cost per recipe unit to eight, and the purchase id, date and supplier the price came from. 0 row(s) report a non-zero rounding residual because the pack size is not a whole number of stock units.
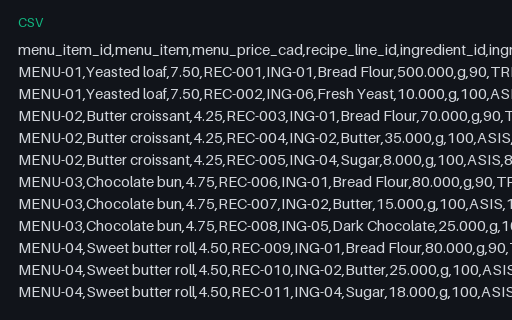
Plate costing lines for Copper Oven Bakery. 11 recipe lines across 4 menu items, 17 columns. Recipe quantities are in grams, millilitres or each; the as-purchased quantity divides by the yield, so the line cost is not a naive multiplication. Plate costs run 0.36 to 0.86 CAD.
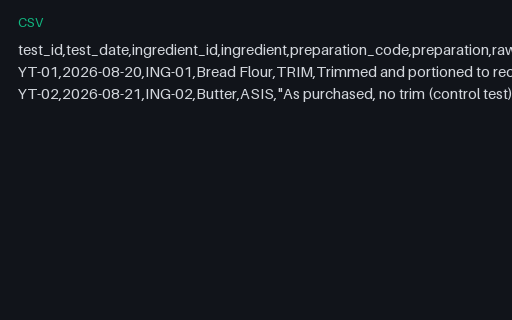
Yield test results for Copper Oven Bakery. 2 yield tests across 17 columns: raw weight, trim waste, trimmed weight, trim yield percent, cooked weight, cooking loss percent and the overall yield factor. All 2 rows report matches_recipe=yes, meaning each measured trim yield equals the yield percent that plate-costs.csv applies to the same ingredient.
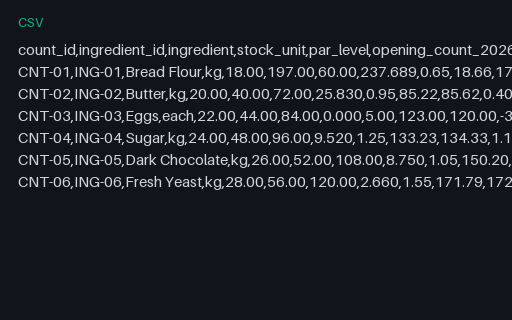
Inventory count sheet for Copper Oven Bakery. 6 ingredients across 17 columns: par level, opening count, receipts, theoretical usage, recorded waste, theoretical closing, counted closing and the variance between them, priced at standard cost. 1 item(s) close below par. These counted closing quantities are the ones cogs-report-inconsistent.csv contradicts.
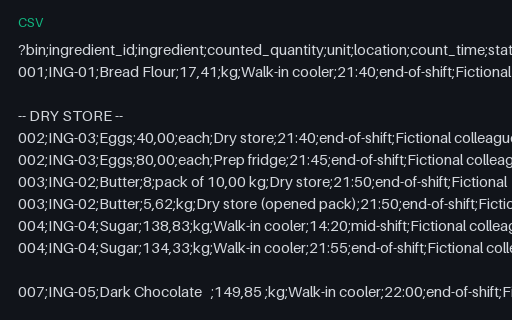
Inventory count sheet as transcribed for Copper Oven Bakery. The same closing counts as inventory-count-sheet.csv, in the shape a paper count actually arrives in. CRLF line endings, a UTF-8 byte order mark, a semicolon delimiter and a decimal comma. Two blank lines, one section banner that is not a record, one ingredient split across two locations, one counted as whole packs plus a remainder, one superseded mid-shift row at 14:20, trailing whitespace in three fields, a leading-zero bin code, an empty bin code, and one record carrying ten fields where the header declares 9. Every quirk is named in README.md.
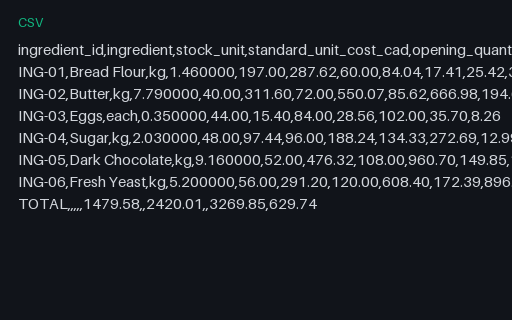
Cost of goods sold that contradicts the count sheet for Copper Oven Bakery. Intentionally inconsistent. Row 3 reports a closing count of 102.00 each for ING-03 (Eggs), the counted figure with the last two whole digits transposed, where inventory-count-sheet.csv, inventory-variance.xlsx and cogs-report.json all count 120.00 each. Every derived value follows the wrong count, so the file is internally consistent and its total of 629.74 CAD differs from the correct 623.44 CAD by 6.30 CAD.
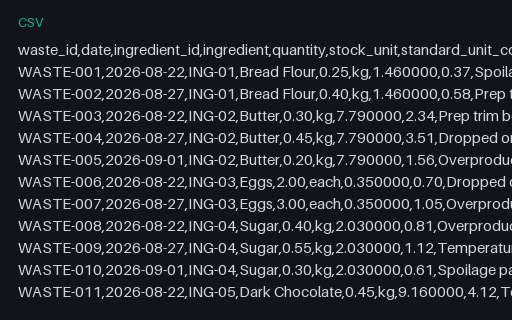
Waste and spoilage log for Copper Oven Bakery. 15 dated waste entries across 11 columns, totalling 30.33 CAD at standard cost. The quantities per ingredient are exactly the recorded waste that inventory-variance.xlsx and cogs-report.xlsx deduct. WASTE-001 lands exactly on a half cent, so a reader that rounds half to even reports a cent less on that row than this file, which rounds half up like every other value in the folder.
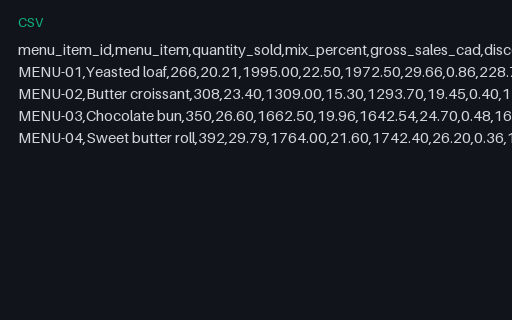
Product mix report for Copper Oven Bakery. 4 menu items across 12 columns for 2026-08-20 to 2026-09-02: quantity sold, mix percent, gross, discount, net, share of net, plate cost, item cost, item margin and item food-cost percent. Quantities and net sales match the shared sales table row for row; total net is 6651.14 CAD.
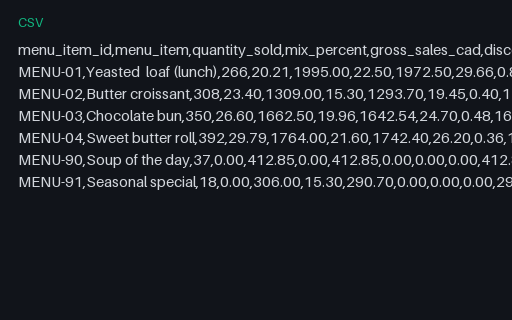
Product mix carrying items the menu does not have for Copper Oven Bakery. Intentionally inconsistent. 6 rows where sales-mix-pmix.csv has 4. MENU-90 and MENU-91 are not in the shared menu table, and the first row renames MENU-01 to "Yeasted loaf (lunch)", which has a doubled space and a suffix the menu does not carry. The remaining rows are correct.
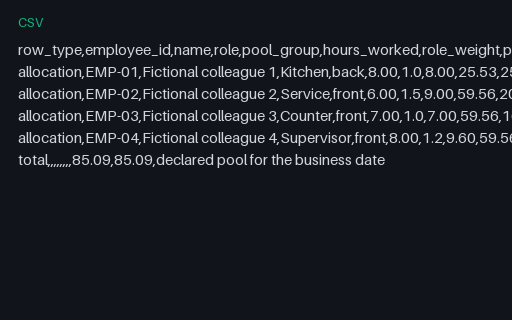
Tip pool distribution for Copper Oven Bakery. 4 allocation rows and one total row for 2026-08-28. The declared pool of 85.09 CAD is 42.34 charged to card plus 42.75 declared cash, split 30 percent to back of house, then allocated within each group by hours times a role weight. Whole cents are assigned by largest remainder, so the rows sum to 85.09 CAD, which equals the pool exactly.
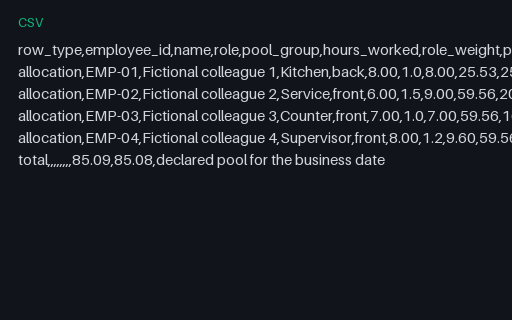
Tip pool that is one cent short for Copper Oven Bakery. Intentionally inconsistent. The last allocation row (EMP-04) reads 22.32 where the exact largest-remainder share is 22.33. The allocation rows therefore sum to 85.08 CAD while the total row still declares the pool as 85.09 CAD, a shortfall of exactly 0.01 CAD.
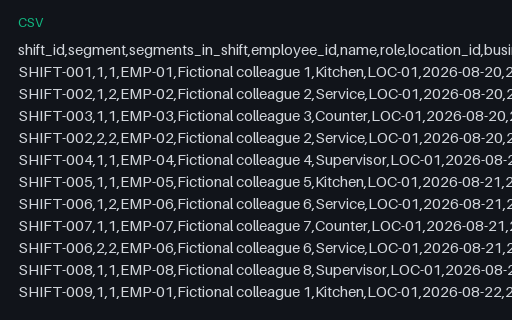
Labour schedule with split and overnight shifts for Copper Oven Bakery. 74 shift segments across 17 columns for 2026-08-20 to 2026-09-02, totalling 413.00 paid hours and 9634.00 CAD of base pay. 14 shifts are split into two segments with an unpaid gap, and 9 segments end on the following calendar day, including SHIFT-056 which runs 22:30 on 2026-09-02 to 05:30 on 2026-09-03. 4 rows are authored cover shifts; the rest reproduce the shared staffing table hour for hour.
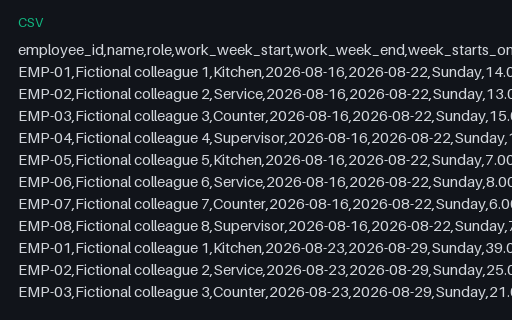
Overtime computed on the wrong week boundary for Copper Oven Bakery. Intentionally inconsistent. The same 74 shift segments are grouped into Sunday-start work weeks where the declared policy, and labour-hours-overtime.xlsx, start each week on Monday. The correct grouping yields 5.00 payable overtime hours and 51.50 CAD of premium; this file yields 3.00 hours and 31.50 CAD. The hours that disappear belong to EMP-01 in the week beginning 2026-08-24, whose 46.00 hours the Sunday grouping splits across two weeks.
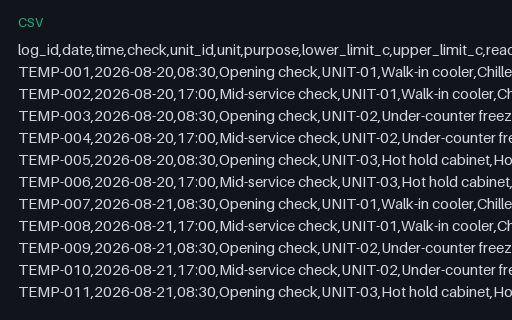
HACCP temperature log for Copper Oven Bakery. 84 readings across 13 columns: 3 units checked twice a day for fourteen days. Each row carries its own lower and upper limit, so the within_limit column can be recomputed from the row beside it. 2 readings fall outside their limit (TEMP-038, TEMP-071) and only those rows carry a corrective action.
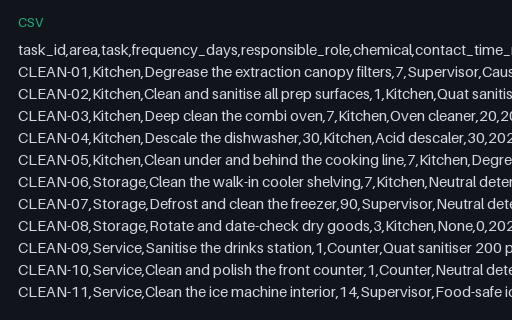
Cleaning schedule for Copper Oven Bakery. 18 tasks across 6 areas and 11 columns, with frequency in days, the responsible role, the chemical and its contact time, the last completion date and a next-due date that is exactly last_completed plus frequency_days. 4 task(s) are overdue at the period end.
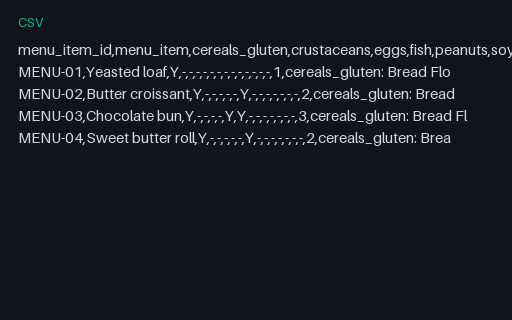
Allergen matrix for Copper Oven Bakery. 4 menu items across 18 columns: the fourteen listed allergens plus a count and a sources column naming the ingredient behind every Y. Derived from the recipe lines, so a dish whose recipe contains a dairy ingredient reads Y under milk. 4 of 4 dishes declare at least one allergen.
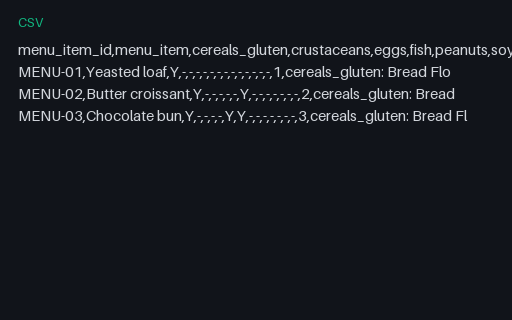
Allergen matrix missing a menu item for Copper Oven Bakery. Intentionally incomplete. 3 rows where the recipes cost 4 menu items. MENU-04 (Sweet butter roll) has no row, although it has costed recipe lines in plate-costs.csv and sales in sales-mix-pmix.csv. Its correct row would declare: cereals_gluten: Bread Flour; milk: Butter.
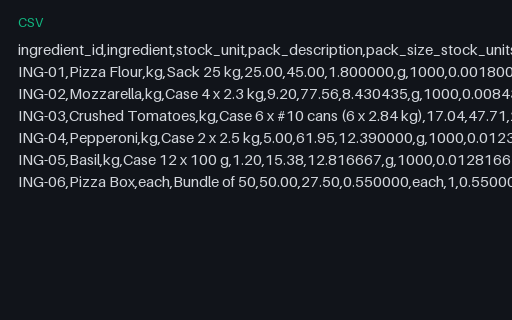
Purchase pack to recipe unit conversions for Ember Lane Pizza. 6 ingredients across 16 columns. Each row carries the purchase pack, the pack price, the cost per stock unit to six decimal places, the cost per recipe unit to eight, and the purchase id, date and supplier the price came from. 3 row(s) report a non-zero rounding residual because the pack size is not a whole number of stock units.
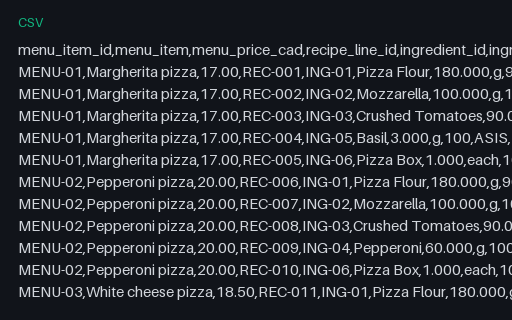
Plate costing lines for Ember Lane Pizza. 18 recipe lines across 4 menu items, 17 columns. Recipe quantities are in grams, millilitres or each; the as-purchased quantity divides by the yield, so the line cost is not a naive multiplication. Plate costs run 2.00 to 2.75 CAD.
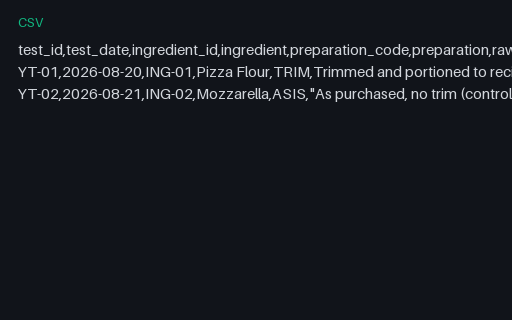
Yield test results for Ember Lane Pizza. 2 yield tests across 17 columns: raw weight, trim waste, trimmed weight, trim yield percent, cooked weight, cooking loss percent and the overall yield factor. All 2 rows report matches_recipe=yes, meaning each measured trim yield equals the yield percent that plate-costs.csv applies to the same ingredient.
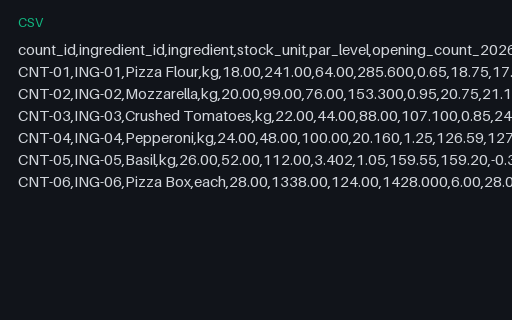
Inventory count sheet for Ember Lane Pizza. 6 ingredients across 17 columns: par level, opening count, receipts, theoretical usage, recorded waste, theoretical closing, counted closing and the variance between them, priced at standard cost. 1 item(s) close below par. These counted closing quantities are the ones cogs-report-inconsistent.csv contradicts.
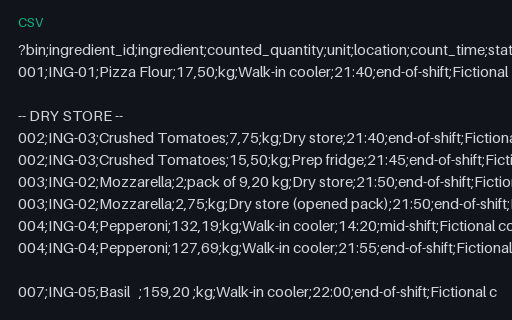
Inventory count sheet as transcribed for Ember Lane Pizza. The same closing counts as inventory-count-sheet.csv, in the shape a paper count actually arrives in. CRLF line endings, a UTF-8 byte order mark, a semicolon delimiter and a decimal comma. Two blank lines, one section banner that is not a record, one ingredient split across two locations, one counted as whole packs plus a remainder, one superseded mid-shift row at 14:20, trailing whitespace in three fields, a leading-zero bin code, an empty bin code, and one record carrying ten fields where the header declares 9. Every quirk is named in README.md.
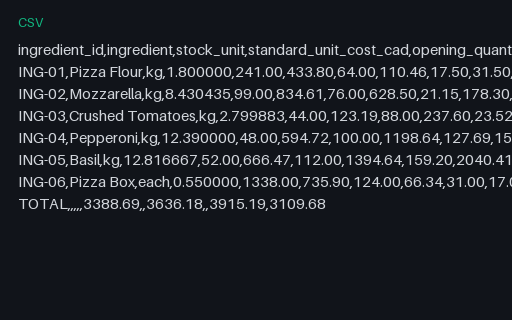
Cost of goods sold that contradicts the count sheet for Ember Lane Pizza. Intentionally inconsistent. Row 3 reports a closing count of 23.52 kg for ING-03 (Crushed Tomatoes), the counted figure with the two decimal digits transposed, where inventory-count-sheet.csv, inventory-variance.xlsx and cogs-report.json all count 23.25 kg. Every derived value follows the wrong count, so the file is internally consistent and its total of 3109.68 CAD differs from the correct 3110.43 CAD by -0.75 CAD.
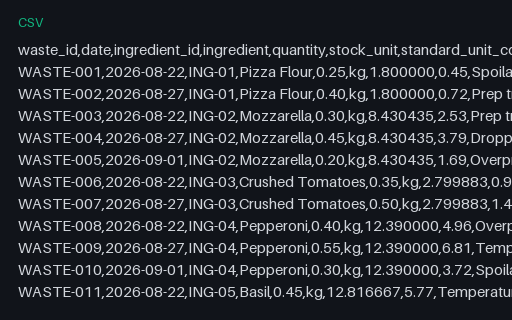
Waste and spoilage log for Ember Lane Pizza. 15 dated waste entries across 11 columns, totalling 43.81 CAD at standard cost. The quantities per ingredient are exactly the recorded waste that inventory-variance.xlsx and cogs-report.xlsx deduct.
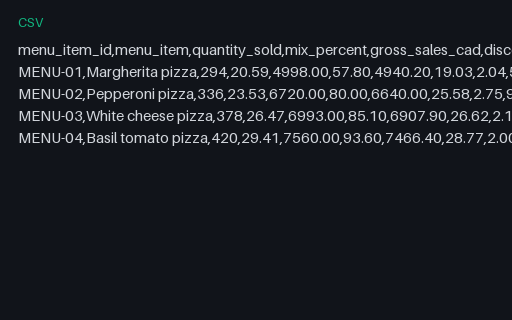
Product mix report for Ember Lane Pizza. 4 menu items across 12 columns for 2026-08-20 to 2026-09-02: quantity sold, mix percent, gross, discount, net, share of net, plate cost, item cost, item margin and item food-cost percent. Quantities and net sales match the shared sales table row for row; total net is 25954.50 CAD.
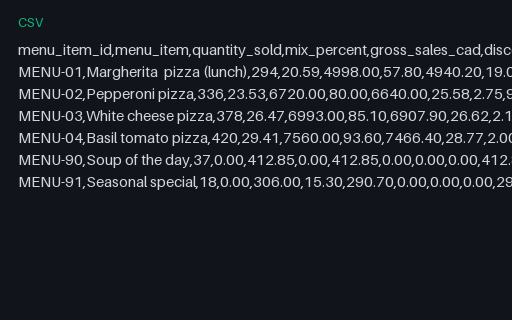
Product mix carrying items the menu does not have for Ember Lane Pizza. Intentionally inconsistent. 6 rows where sales-mix-pmix.csv has 4. MENU-90 and MENU-91 are not in the shared menu table, and the first row renames MENU-01 to "Margherita pizza (lunch)", which has a doubled space and a suffix the menu does not carry. The remaining rows are correct.
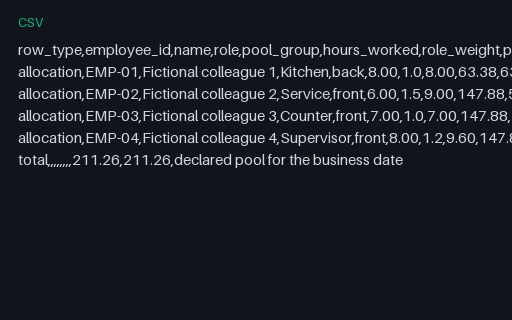
Tip pool distribution for Ember Lane Pizza. 4 allocation rows and one total row for 2026-08-28. The declared pool of 211.26 CAD is 168.51 charged to card plus 42.75 declared cash, split 30 percent to back of house, then allocated within each group by hours times a role weight. Whole cents are assigned by largest remainder, so the rows sum to 211.26 CAD, which equals the pool exactly.
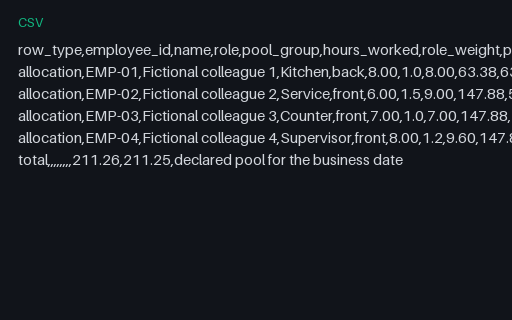
Tip pool that is one cent short for Ember Lane Pizza. Intentionally inconsistent. The last allocation row (EMP-04) reads 55.44 where the exact largest-remainder share is 55.45. The allocation rows therefore sum to 211.25 CAD while the total row still declares the pool as 211.26 CAD, a shortfall of exactly 0.01 CAD.
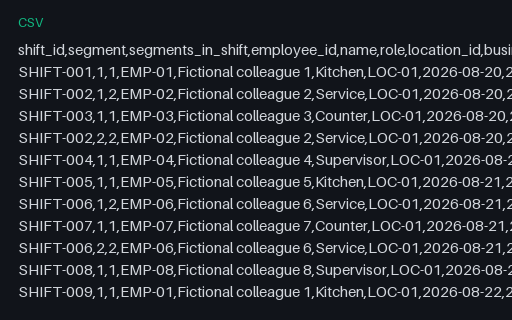
Labour schedule with split and overnight shifts for Ember Lane Pizza. 74 shift segments across 17 columns for 2026-08-20 to 2026-09-02, totalling 413.00 paid hours and 9634.00 CAD of base pay. 14 shifts are split into two segments with an unpaid gap, and 9 segments end on the following calendar day, including SHIFT-056 which runs 22:30 on 2026-09-02 to 05:30 on 2026-09-03. 4 rows are authored cover shifts; the rest reproduce the shared staffing table hour for hour.
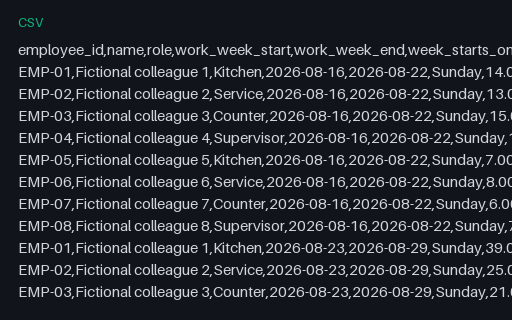
Overtime computed on the wrong week boundary for Ember Lane Pizza. Intentionally inconsistent. The same 74 shift segments are grouped into Sunday-start work weeks where the declared policy, and labour-hours-overtime.xlsx, start each week on Monday. The correct grouping yields 5.00 payable overtime hours and 51.50 CAD of premium; this file yields 3.00 hours and 31.50 CAD. The hours that disappear belong to EMP-01 in the week beginning 2026-08-24, whose 46.00 hours the Sunday grouping splits across two weeks.
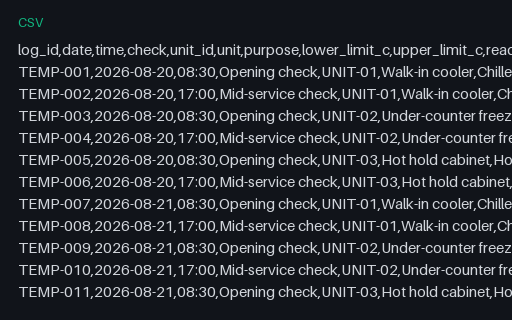
HACCP temperature log for Ember Lane Pizza. 84 readings across 13 columns: 3 units checked twice a day for fourteen days. Each row carries its own lower and upper limit, so the within_limit column can be recomputed from the row beside it. 2 readings fall outside their limit (TEMP-038, TEMP-071) and only those rows carry a corrective action.
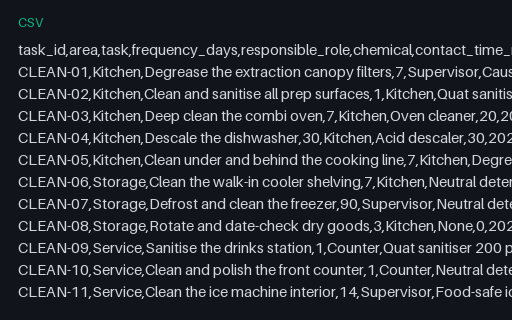
Cleaning schedule for Ember Lane Pizza. 18 tasks across 6 areas and 11 columns, with frequency in days, the responsible role, the chemical and its contact time, the last completion date and a next-due date that is exactly last_completed plus frequency_days. 4 task(s) are overdue at the period end.
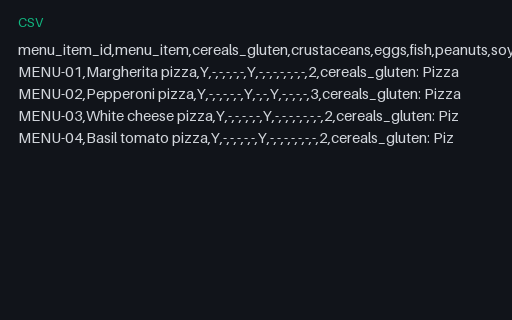
Allergen matrix for Ember Lane Pizza. 4 menu items across 18 columns: the fourteen listed allergens plus a count and a sources column naming the ingredient behind every Y. Derived from the recipe lines, so a dish whose recipe contains a dairy ingredient reads Y under milk. 4 of 4 dishes declare at least one allergen.
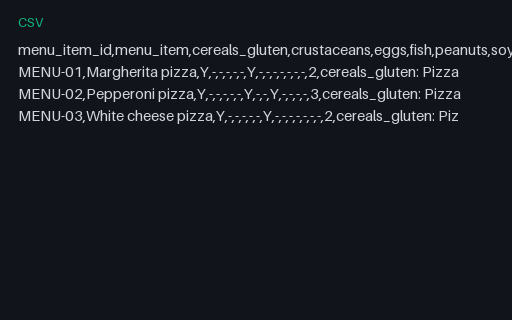
Allergen matrix missing a menu item for Ember Lane Pizza. Intentionally incomplete. 3 rows where the recipes cost 4 menu items. MENU-04 (Basil tomato pizza) has no row, although it has costed recipe lines in plate-costs.csv and sales in sales-mix-pmix.csv. Its correct row would declare: cereals_gluten: Pizza Flour; milk: Mozzarella.
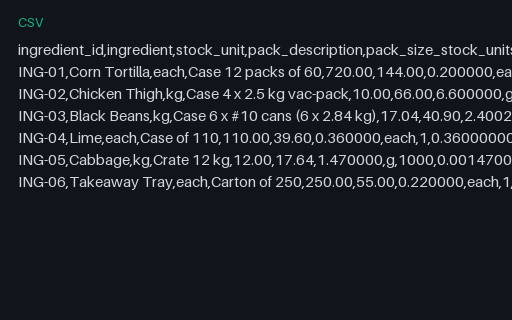
Purchase pack to recipe unit conversions for Cedar Street Tacos. 6 ingredients across 16 columns. Each row carries the purchase pack, the pack price, the cost per stock unit to six decimal places, the cost per recipe unit to eight, and the purchase id, date and supplier the price came from. 1 row(s) report a non-zero rounding residual because the pack size is not a whole number of stock units.
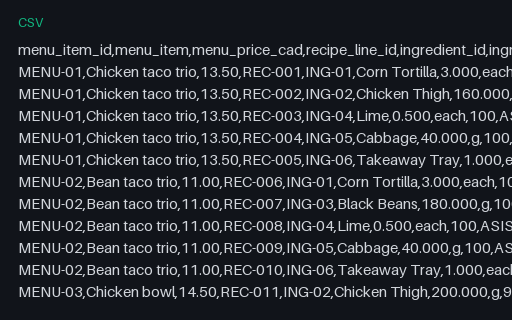
Plate costing lines for Cedar Street Tacos. 18 recipe lines across 4 menu items, 17 columns. Recipe quantities are in grams, millilitres or each; the as-purchased quantity divides by the yield, so the line cost is not a naive multiplication. Plate costs run 1.18 to 2.11 CAD.
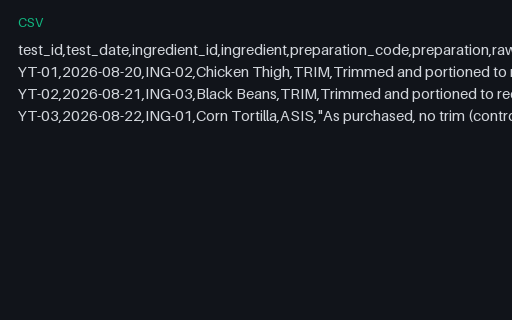
Yield test results for Cedar Street Tacos. 3 yield tests across 17 columns: raw weight, trim waste, trimmed weight, trim yield percent, cooked weight, cooking loss percent and the overall yield factor. All 3 rows report matches_recipe=yes, meaning each measured trim yield equals the yield percent that plate-costs.csv applies to the same ingredient.
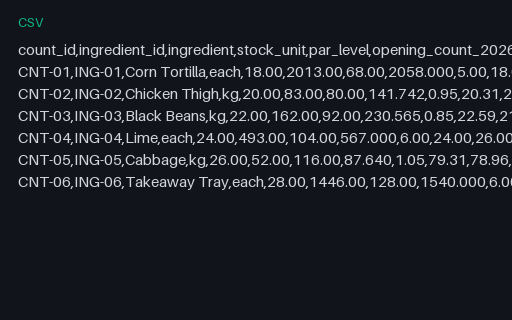
Inventory count sheet for Cedar Street Tacos. 6 ingredients across 17 columns: par level, opening count, receipts, theoretical usage, recorded waste, theoretical closing, counted closing and the variance between them, priced at standard cost. 2 item(s) close below par. These counted closing quantities are the ones cogs-report-inconsistent.csv contradicts. Theoretical closing on CNT-03 lands exactly on a half hundredth of a stock unit, so a reader that rounds half to even prints a different figure than this file, which rounds half up throughout.
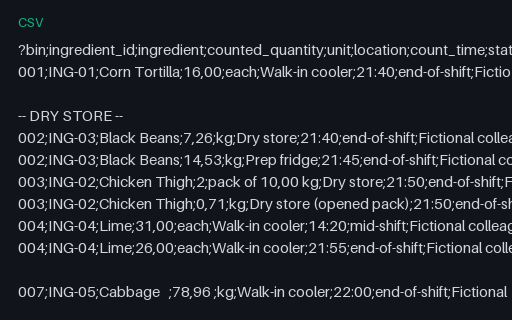
Inventory count sheet as transcribed for Cedar Street Tacos. The same closing counts as inventory-count-sheet.csv, in the shape a paper count actually arrives in. CRLF line endings, a UTF-8 byte order mark, a semicolon delimiter and a decimal comma. Two blank lines, one section banner that is not a record, one ingredient split across two locations, one counted as whole packs plus a remainder, one superseded mid-shift row at 14:20, trailing whitespace in three fields, a leading-zero bin code, an empty bin code, and one record carrying ten fields where the header declares 9. Every quirk is named in README.md.
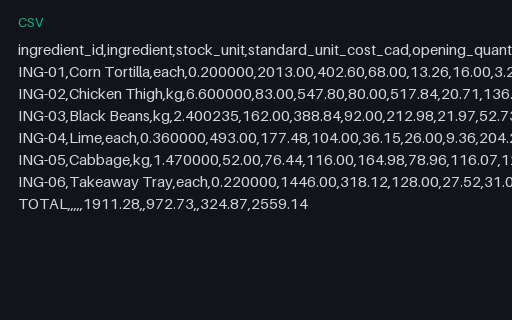
Cost of goods sold that contradicts the count sheet for Cedar Street Tacos. Intentionally inconsistent. Row 3 reports a closing count of 21.97 kg for ING-03 (Black Beans), the counted figure with the two decimal digits transposed, where inventory-count-sheet.csv, inventory-variance.xlsx and cogs-report.json all count 21.79 kg. Every derived value follows the wrong count, so the file is internally consistent and its total of 2559.14 CAD differs from the correct 2559.57 CAD by -0.43 CAD.
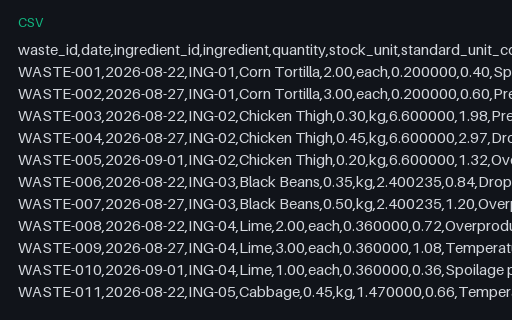
Waste and spoilage log for Cedar Street Tacos. 15 dated waste entries across 11 columns, totalling 14.33 CAD at standard cost. The quantities per ingredient are exactly the recorded waste that inventory-variance.xlsx and cogs-report.xlsx deduct.
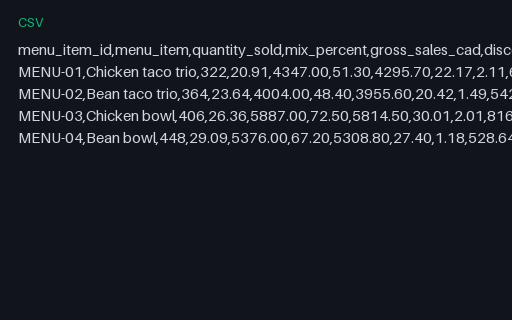
Product mix report for Cedar Street Tacos. 4 menu items across 12 columns for 2026-08-20 to 2026-09-02: quantity sold, mix percent, gross, discount, net, share of net, plate cost, item cost, item margin and item food-cost percent. Quantities and net sales match the shared sales table row for row; total net is 19374.60 CAD.
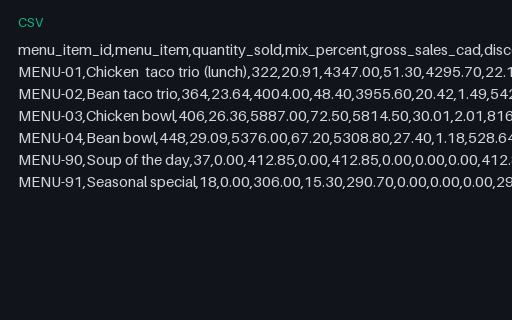
Product mix carrying items the menu does not have for Cedar Street Tacos. Intentionally inconsistent. 6 rows where sales-mix-pmix.csv has 4. MENU-90 and MENU-91 are not in the shared menu table, and the first row renames MENU-01 to "Chicken taco trio (lunch)", which has a doubled space and a suffix the menu does not carry. The remaining rows are correct.
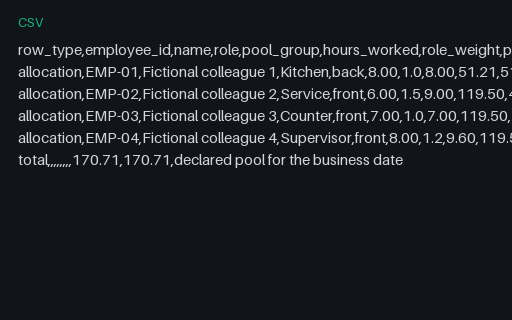
Tip pool distribution for Cedar Street Tacos. 4 allocation rows and one total row for 2026-08-28. The declared pool of 170.71 CAD is 127.96 charged to card plus 42.75 declared cash, split 30 percent to back of house, then allocated within each group by hours times a role weight. Whole cents are assigned by largest remainder, so the rows sum to 170.71 CAD, which equals the pool exactly.
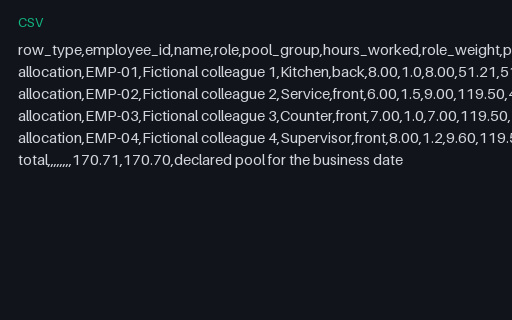
Tip pool that is one cent short for Cedar Street Tacos. Intentionally inconsistent. The last allocation row (EMP-04) reads 44.80 where the exact largest-remainder share is 44.81. The allocation rows therefore sum to 170.70 CAD while the total row still declares the pool as 170.71 CAD, a shortfall of exactly 0.01 CAD.
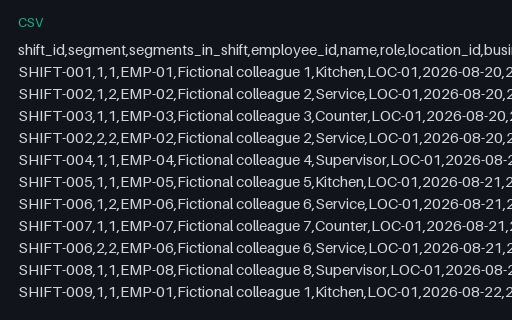
Labour schedule with split and overnight shifts for Cedar Street Tacos. 74 shift segments across 17 columns for 2026-08-20 to 2026-09-02, totalling 413.00 paid hours and 9634.00 CAD of base pay. 14 shifts are split into two segments with an unpaid gap, and 9 segments end on the following calendar day, including SHIFT-056 which runs 22:30 on 2026-09-02 to 05:30 on 2026-09-03. 4 rows are authored cover shifts; the rest reproduce the shared staffing table hour for hour.
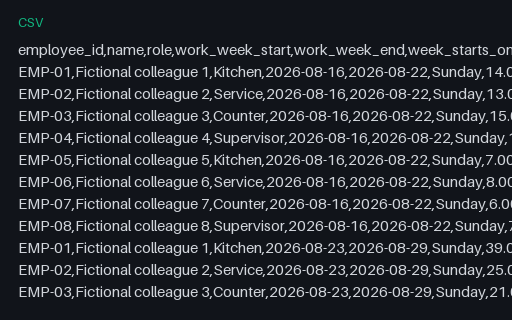
Overtime computed on the wrong week boundary for Cedar Street Tacos. Intentionally inconsistent. The same 74 shift segments are grouped into Sunday-start work weeks where the declared policy, and labour-hours-overtime.xlsx, start each week on Monday. The correct grouping yields 5.00 payable overtime hours and 51.50 CAD of premium; this file yields 3.00 hours and 31.50 CAD. The hours that disappear belong to EMP-01 in the week beginning 2026-08-24, whose 46.00 hours the Sunday grouping splits across two weeks.
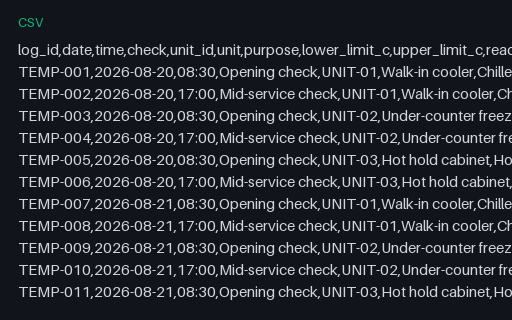
HACCP temperature log for Cedar Street Tacos. 84 readings across 13 columns: 3 units checked twice a day for fourteen days. Each row carries its own lower and upper limit, so the within_limit column can be recomputed from the row beside it. 2 readings fall outside their limit (TEMP-038, TEMP-071) and only those rows carry a corrective action.
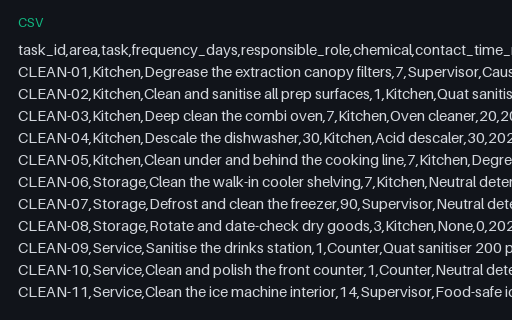
Cleaning schedule for Cedar Street Tacos. 18 tasks across 6 areas and 11 columns, with frequency in days, the responsible role, the chemical and its contact time, the last completion date and a next-due date that is exactly last_completed plus frequency_days. 4 task(s) are overdue at the period end.
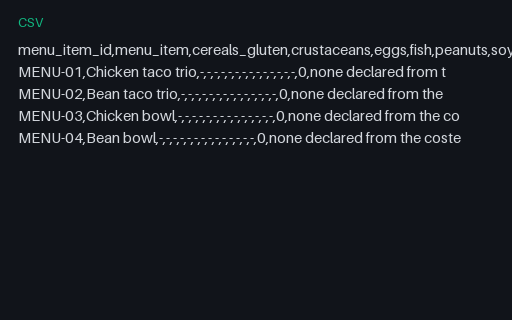
Allergen matrix for Cedar Street Tacos. 4 menu items across 18 columns: the fourteen listed allergens plus a count and a sources column naming the ingredient behind every Y. Derived from the recipe lines, so a dish whose recipe contains a dairy ingredient reads Y under milk. 0 of 4 dishes declare at least one allergen.
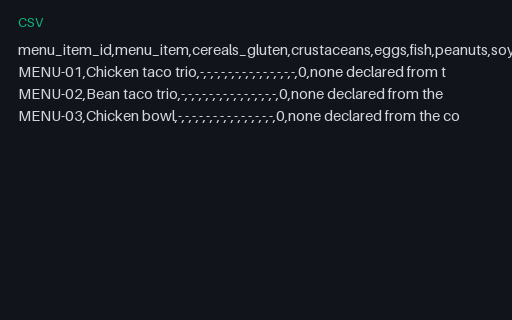
Allergen matrix missing a menu item for Cedar Street Tacos. Intentionally incomplete. 3 rows where the recipes cost 4 menu items. MENU-04 (Bean bowl) has no row, although it has costed recipe lines in plate-costs.csv and sales in sales-mix-pmix.csv. Its correct row would declare: none declared from the costed recipe lines.
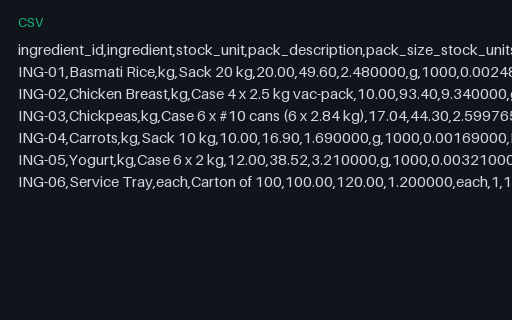
Purchase pack to recipe unit conversions for Willow Event Kitchen. 6 ingredients across 16 columns. Each row carries the purchase pack, the pack price, the cost per stock unit to six decimal places, the cost per recipe unit to eight, and the purchase id, date and supplier the price came from. 1 row(s) report a non-zero rounding residual because the pack size is not a whole number of stock units.
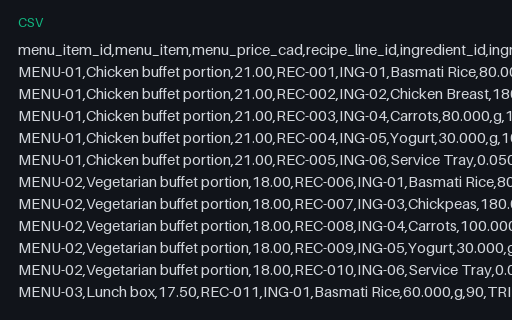
Plate costing lines for Willow Event Kitchen. 19 recipe lines across 4 menu items, 17 columns. Recipe quantities are in grams, millilitres or each; the as-purchased quantity divides by the yield, so the line cost is not a naive multiplication. Plate costs run 0.72 to 2.19 CAD.
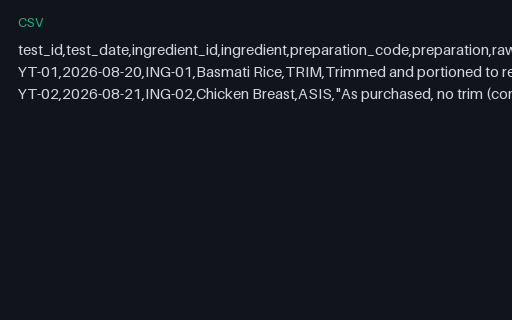
Yield test results for Willow Event Kitchen. 2 yield tests across 17 columns: raw weight, trim waste, trimmed weight, trim yield percent, cooked weight, cooking loss percent and the overall yield factor. All 2 rows report matches_recipe=yes, meaning each measured trim yield equals the yield percent that plate-costs.csv applies to the same ingredient.
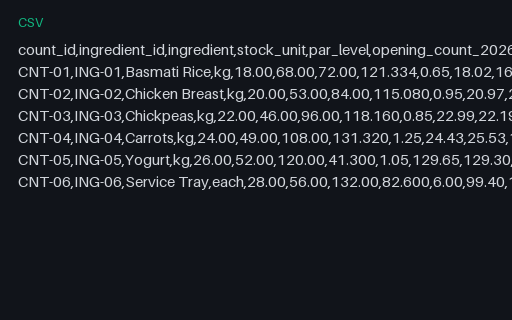
Inventory count sheet for Willow Event Kitchen. 6 ingredients across 17 columns: par level, opening count, receipts, theoretical usage, recorded waste, theoretical closing, counted closing and the variance between them, priced at standard cost. 1 item(s) close below par. These counted closing quantities are the ones cogs-report-inconsistent.csv contradicts.
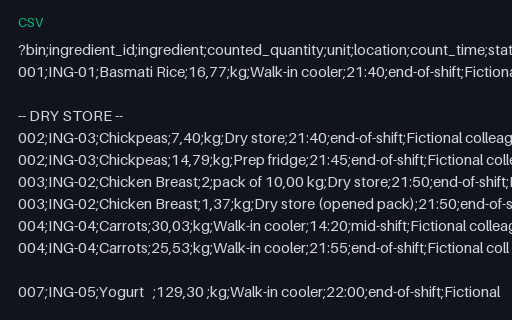
Inventory count sheet as transcribed for Willow Event Kitchen. The same closing counts as inventory-count-sheet.csv, in the shape a paper count actually arrives in. CRLF line endings, a UTF-8 byte order mark, a semicolon delimiter and a decimal comma. Two blank lines, one section banner that is not a record, one ingredient split across two locations, one counted as whole packs plus a remainder, one superseded mid-shift row at 14:20, trailing whitespace in three fields, a leading-zero bin code, an empty bin code, and one record carrying ten fields where the header declares 9. Every quirk is named in README.md.
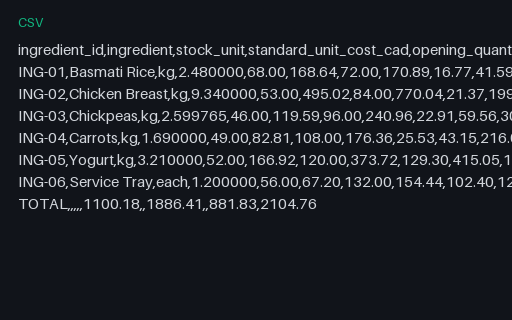
Cost of goods sold that contradicts the count sheet for Willow Event Kitchen. Intentionally inconsistent. Row 3 reports a closing count of 22.91 kg for ING-03 (Chickpeas), the counted figure with the two decimal digits transposed, where inventory-count-sheet.csv, inventory-variance.xlsx and cogs-report.json all count 22.19 kg. Every derived value follows the wrong count, so the file is internally consistent and its total of 2104.76 CAD differs from the correct 2106.63 CAD by -1.87 CAD.
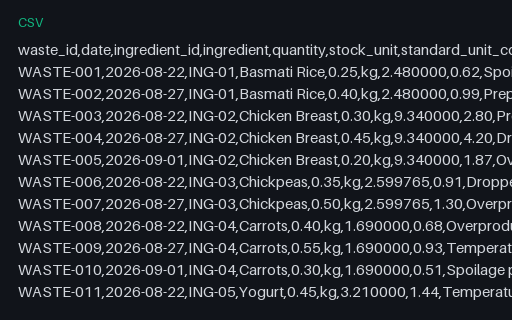
Waste and spoilage log for Willow Event Kitchen. 15 dated waste entries across 11 columns, totalling 25.38 CAD at standard cost. The quantities per ingredient are exactly the recorded waste that inventory-variance.xlsx and cogs-report.xlsx deduct.
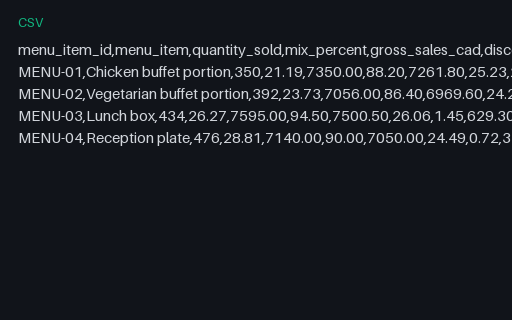
Product mix report for Willow Event Kitchen. 4 menu items across 12 columns for 2026-08-20 to 2026-09-02: quantity sold, mix percent, gross, discount, net, share of net, plate cost, item cost, item margin and item food-cost percent. Quantities and net sales match the shared sales table row for row; total net is 28781.90 CAD.
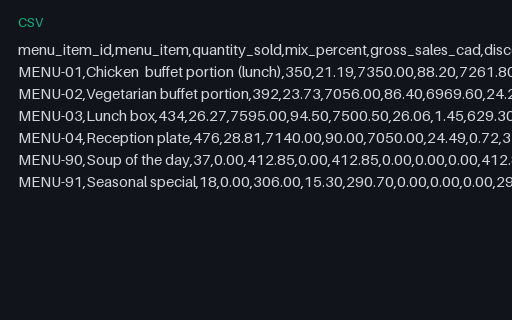
Product mix carrying items the menu does not have for Willow Event Kitchen. Intentionally inconsistent. 6 rows where sales-mix-pmix.csv has 4. MENU-90 and MENU-91 are not in the shared menu table, and the first row renames MENU-01 to "Chicken buffet portion (lunch)", which has a doubled space and a suffix the menu does not carry. The remaining rows are correct.
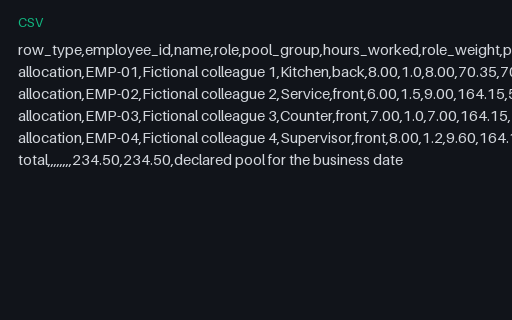
Tip pool distribution for Willow Event Kitchen. 4 allocation rows and one total row for 2026-08-28. The declared pool of 234.50 CAD is 191.75 charged to card plus 42.75 declared cash, split 30 percent to back of house, then allocated within each group by hours times a role weight. Whole cents are assigned by largest remainder, so the rows sum to 234.50 CAD, which equals the pool exactly.
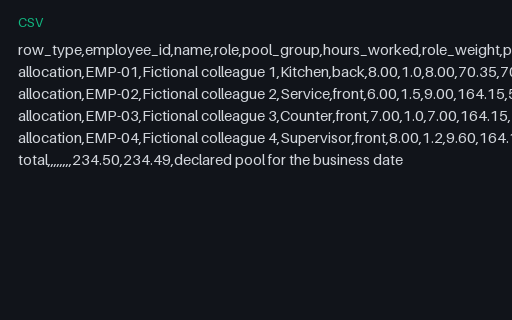
Tip pool that is one cent short for Willow Event Kitchen. Intentionally inconsistent. The last allocation row (EMP-04) reads 61.55 where the exact largest-remainder share is 61.56. The allocation rows therefore sum to 234.49 CAD while the total row still declares the pool as 234.50 CAD, a shortfall of exactly 0.01 CAD.
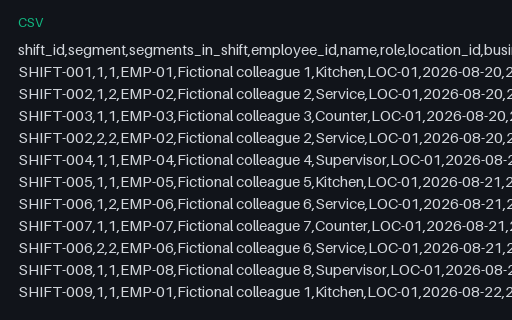
Labour schedule with split and overnight shifts for Willow Event Kitchen. 74 shift segments across 17 columns for 2026-08-20 to 2026-09-02, totalling 413.00 paid hours and 9634.00 CAD of base pay. 14 shifts are split into two segments with an unpaid gap, and 9 segments end on the following calendar day, including SHIFT-056 which runs 22:30 on 2026-09-02 to 05:30 on 2026-09-03. 4 rows are authored cover shifts; the rest reproduce the shared staffing table hour for hour.
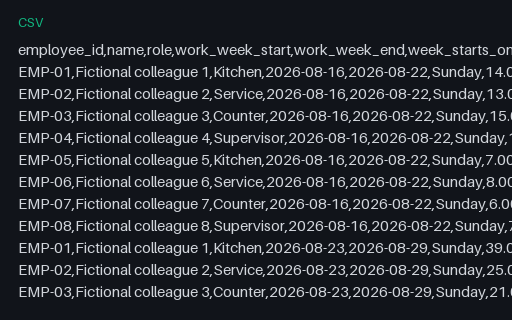
Overtime computed on the wrong week boundary for Willow Event Kitchen. Intentionally inconsistent. The same 74 shift segments are grouped into Sunday-start work weeks where the declared policy, and labour-hours-overtime.xlsx, start each week on Monday. The correct grouping yields 5.00 payable overtime hours and 51.50 CAD of premium; this file yields 3.00 hours and 31.50 CAD. The hours that disappear belong to EMP-01 in the week beginning 2026-08-24, whose 46.00 hours the Sunday grouping splits across two weeks.
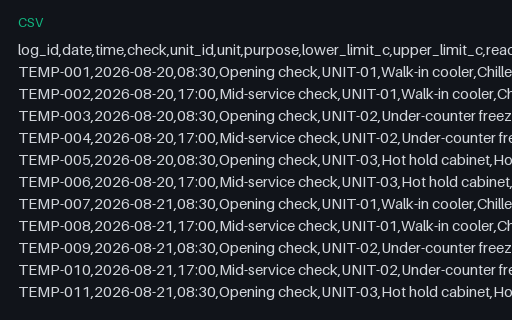
HACCP temperature log for Willow Event Kitchen. 84 readings across 13 columns: 3 units checked twice a day for fourteen days. Each row carries its own lower and upper limit, so the within_limit column can be recomputed from the row beside it. 2 readings fall outside their limit (TEMP-038, TEMP-071) and only those rows carry a corrective action.
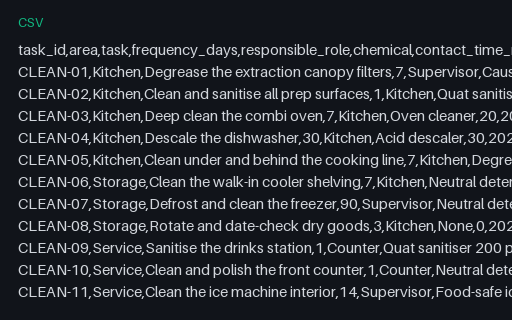
Cleaning schedule for Willow Event Kitchen. 18 tasks across 6 areas and 11 columns, with frequency in days, the responsible role, the chemical and its contact time, the last completion date and a next-due date that is exactly last_completed plus frequency_days. 4 task(s) are overdue at the period end.
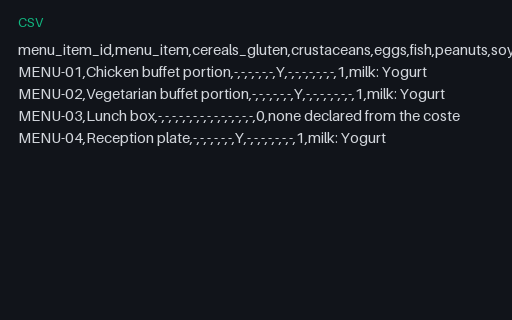
Allergen matrix for Willow Event Kitchen. 4 menu items across 18 columns: the fourteen listed allergens plus a count and a sources column naming the ingredient behind every Y. Derived from the recipe lines, so a dish whose recipe contains a dairy ingredient reads Y under milk. 3 of 4 dishes declare at least one allergen.
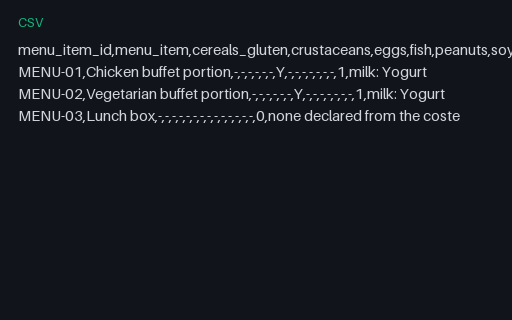
Allergen matrix missing a menu item for Willow Event Kitchen. Intentionally incomplete. 3 rows where the recipes cost 4 menu items. MENU-04 (Reception plate) has no row, although it has costed recipe lines in plate-costs.csv and sales in sales-mix-pmix.csv. Its correct row would declare: milk: Yogurt.
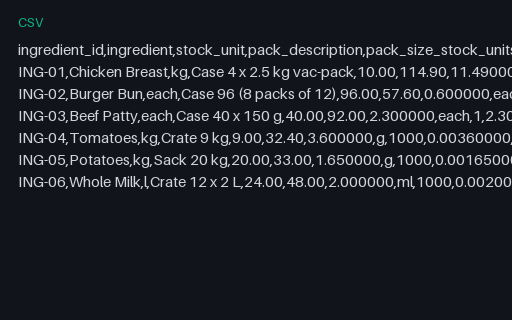
Purchase pack to recipe unit conversions for Harbour Kitchen Group. 6 ingredients across 16 columns. Each row carries the purchase pack, the pack price, the cost per stock unit to six decimal places, the cost per recipe unit to eight, and the purchase id, date and supplier the price came from. 0 row(s) report a non-zero rounding residual because the pack size is not a whole number of stock units.
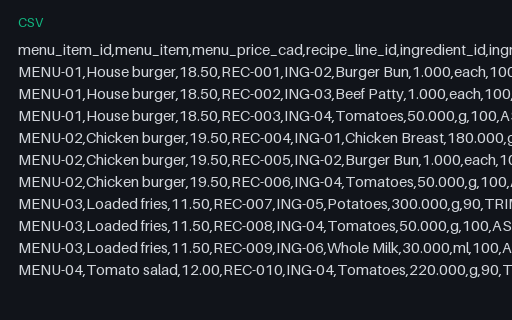
Plate costing lines for Harbour Kitchen Group. 10 recipe lines across 4 menu items, 17 columns. Recipe quantities are in grams, millilitres or each; the as-purchased quantity divides by the yield, so the line cost is not a naive multiplication. Plate costs run 0.79 to 3.08 CAD.
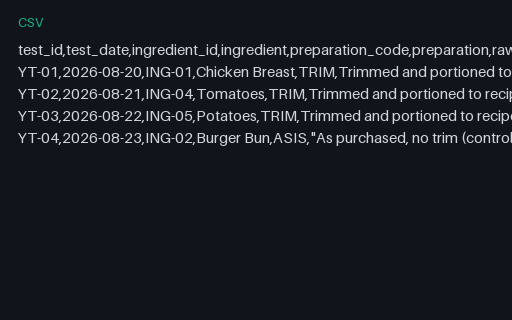
Yield test results for Harbour Kitchen Group. 4 yield tests across 17 columns: raw weight, trim waste, trimmed weight, trim yield percent, cooked weight, cooking loss percent and the overall yield factor. All 4 rows report matches_recipe=yes, meaning each measured trim yield equals the yield percent that plate-costs.csv applies to the same ingredient.
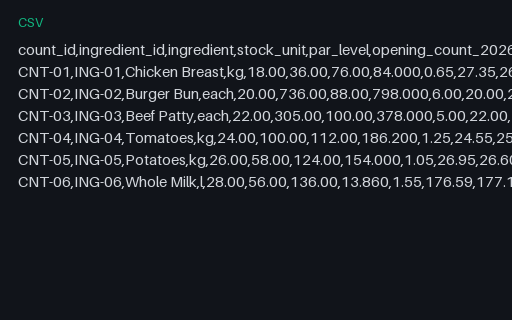
Inventory count sheet for Harbour Kitchen Group. 6 ingredients across 17 columns: par level, opening count, receipts, theoretical usage, recorded waste, theoretical closing, counted closing and the variance between them, priced at standard cost. 1 item(s) close below par. These counted closing quantities are the ones cogs-report-inconsistent.csv contradicts.
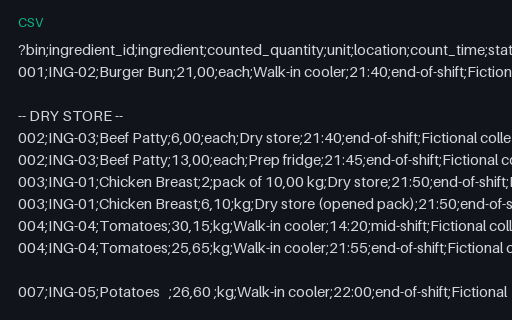
Inventory count sheet as transcribed for Harbour Kitchen Group. The same closing counts as inventory-count-sheet.csv, in the shape a paper count actually arrives in. CRLF line endings, a UTF-8 byte order mark, a semicolon delimiter and a decimal comma. Two blank lines, one section banner that is not a record, one ingredient split across two locations, one counted as whole packs plus a remainder, one superseded mid-shift row at 14:20, trailing whitespace in three fields, a leading-zero bin code, an empty bin code, and one record carrying ten fields where the header declares 9. Every quirk is named in README.md.
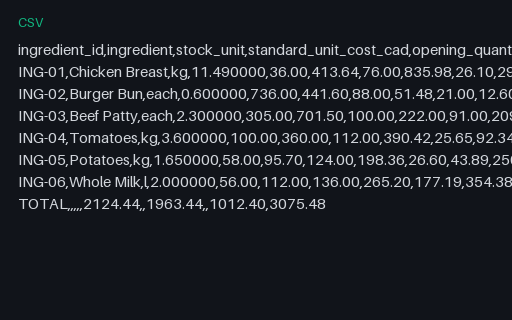
Cost of goods sold that contradicts the count sheet for Harbour Kitchen Group. Intentionally inconsistent. Row 3 reports a closing count of 91.00 each for ING-03 (Beef Patty), the counted figure with the last two whole digits transposed, where inventory-count-sheet.csv, inventory-variance.xlsx and cogs-report.json all count 19.00 each. Every derived value follows the wrong count, so the file is internally consistent and its total of 3075.48 CAD differs from the correct 3241.08 CAD by -165.60 CAD.
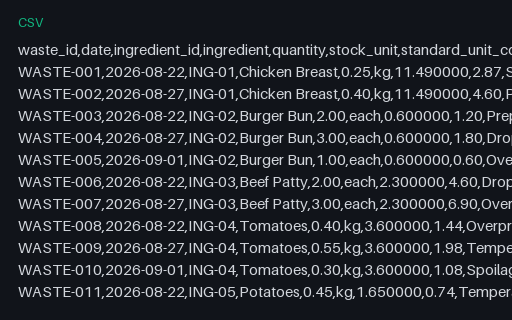
Waste and spoilage log for Harbour Kitchen Group. 15 dated waste entries across 11 columns, totalling 31.90 CAD at standard cost. The quantities per ingredient are exactly the recorded waste that inventory-variance.xlsx and cogs-report.xlsx deduct.
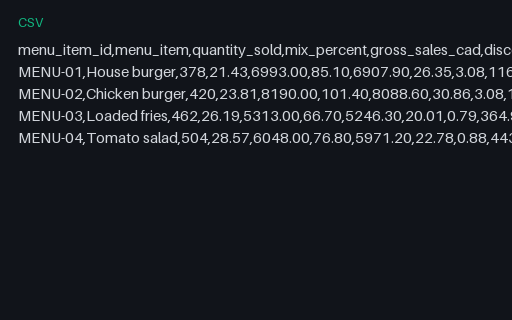
Product mix report for Harbour Kitchen Group. 4 menu items across 12 columns for 2026-08-20 to 2026-09-02: quantity sold, mix percent, gross, discount, net, share of net, plate cost, item cost, item margin and item food-cost percent. Quantities and net sales match the shared sales table row for row; total net is 26214.00 CAD.
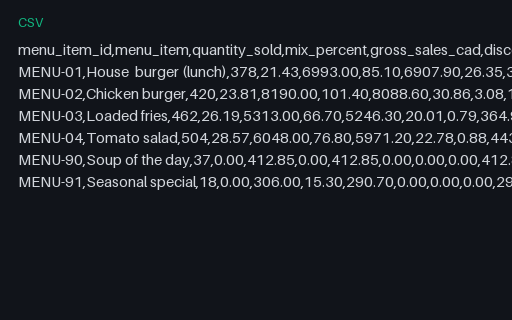
Product mix carrying items the menu does not have for Harbour Kitchen Group. Intentionally inconsistent. 6 rows where sales-mix-pmix.csv has 4. MENU-90 and MENU-91 are not in the shared menu table, and the first row renames MENU-01 to "House burger (lunch)", which has a doubled space and a suffix the menu does not carry. The remaining rows are correct.
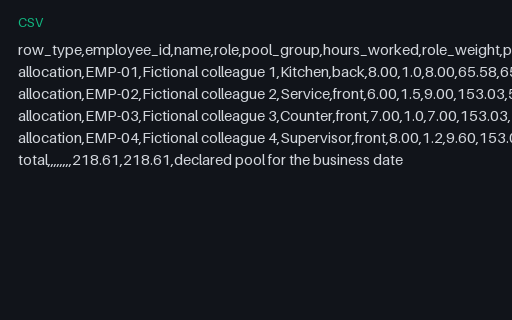
Tip pool distribution for Harbour Kitchen Group. 4 allocation rows and one total row for 2026-08-28. The declared pool of 218.61 CAD is 175.86 charged to card plus 42.75 declared cash, split 30 percent to back of house, then allocated within each group by hours times a role weight. Whole cents are assigned by largest remainder, so the rows sum to 218.61 CAD, which equals the pool exactly.
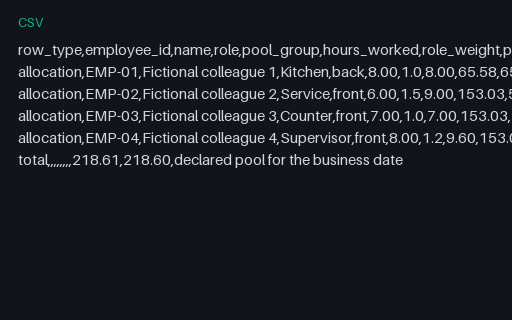
Tip pool that is one cent short for Harbour Kitchen Group. Intentionally inconsistent. The last allocation row (EMP-04) reads 57.38 where the exact largest-remainder share is 57.39. The allocation rows therefore sum to 218.60 CAD while the total row still declares the pool as 218.61 CAD, a shortfall of exactly 0.01 CAD.
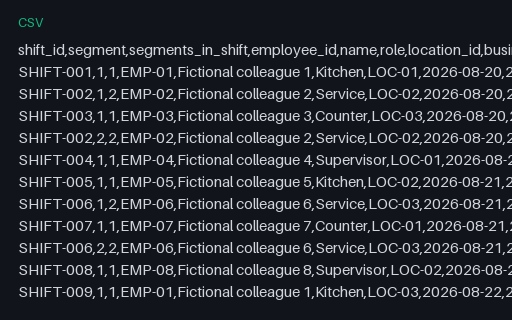
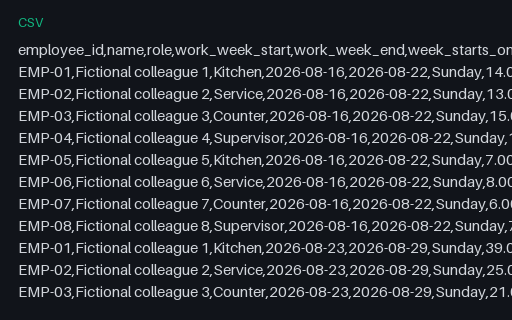
Labour schedule with split and overnight shifts for Harbour Kitchen Group. 74 shift segments across 17 columns for 2026-08-20 to 2026-09-02, totalling 413.00 paid hours and 9634.00 CAD of base pay. 14 shifts are split into two segments with an unpaid gap, and 9 segments end on the following calendar day, including SHIFT-056 which runs 22:30 on 2026-09-02 to 05:30 on 2026-09-03. 4 rows are authored cover shifts; the rest reproduce the shared staffing table hour for hour.
Overtime computed on the wrong week boundary for Harbour Kitchen Group. Intentionally inconsistent. The same 74 shift segments are grouped into Sunday-start work weeks where the declared policy, and labour-hours-overtime.xlsx, start each week on Monday. The correct grouping yields 5.00 payable overtime hours and 51.50 CAD of premium; this file yields 3.00 hours and 31.50 CAD. The hours that disappear belong to EMP-01 in the week beginning 2026-08-24, whose 46.00 hours the Sunday grouping splits across two weeks.
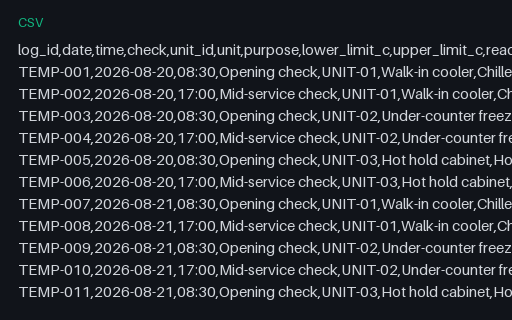
HACCP temperature log for Harbour Kitchen Group. 84 readings across 13 columns: 3 units checked twice a day for fourteen days. Each row carries its own lower and upper limit, so the within_limit column can be recomputed from the row beside it. 2 readings fall outside their limit (TEMP-038, TEMP-071) and only those rows carry a corrective action.
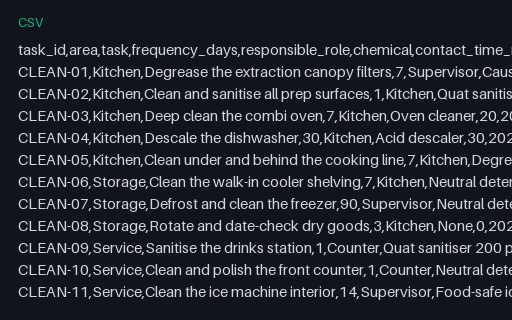
Cleaning schedule for Harbour Kitchen Group. 18 tasks across 6 areas and 11 columns, with frequency in days, the responsible role, the chemical and its contact time, the last completion date and a next-due date that is exactly last_completed plus frequency_days. 4 task(s) are overdue at the period end.
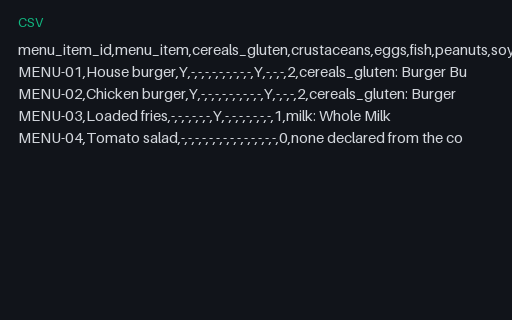
Allergen matrix for Harbour Kitchen Group. 4 menu items across 18 columns: the fourteen listed allergens plus a count and a sources column naming the ingredient behind every Y. Derived from the recipe lines, so a dish whose recipe contains a dairy ingredient reads Y under milk. 3 of 4 dishes declare at least one allergen.
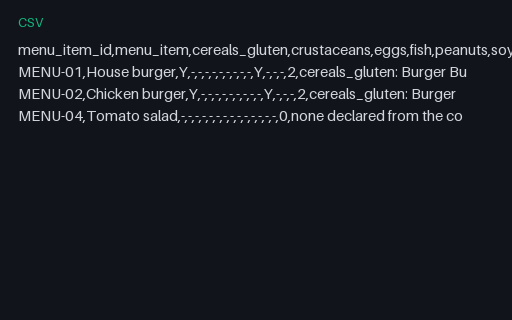
Allergen matrix missing a menu item for Harbour Kitchen Group. Intentionally incomplete. 3 rows where the recipes cost 4 menu items. MENU-03 (Loaded fries) has no row, although it has costed recipe lines in plate-costs.csv and sales in sales-mix-pmix.csv. Its correct row would declare: milk: Whole Milk.
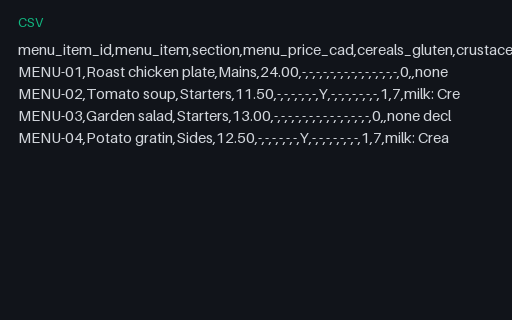
Allergen menu as data for Alder Table Bistro. 4 rows and 21 columns: the menu item id, the printed section, the menu price, the 14 allergen columns, the declared count and the ingredient sources. 2 of 4 dishes declare at least one allergen. Joins to printed-menu.pdf and to plate-costs.csv on menu_item_id.
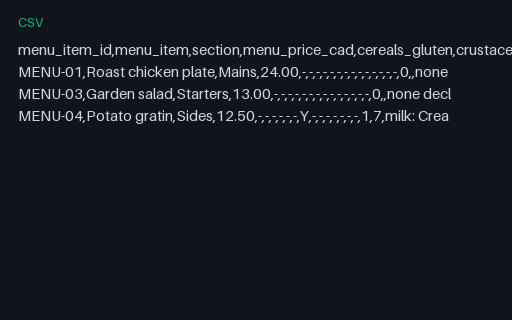
Allergen menu missing a dish on the menu for Alder Table Bistro. Intentionally incomplete. 3 rows where allergen-menu.csv has 4. MENU-02 Tomato soup is printed on printed-menu.pdf at 11.50 CAD and declares 1 allergen in the costing folder, and it has no row here. The remaining rows are correct.
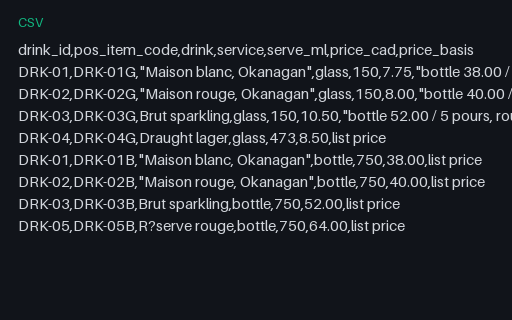
Drinks list as data for Alder Table Bistro. 8 rows and 7 columns pairing every printed drink line with the till item code it imports as, the serve size in millilitres and the basis of its price. The three drinks sold both ways appear twice, once per service.
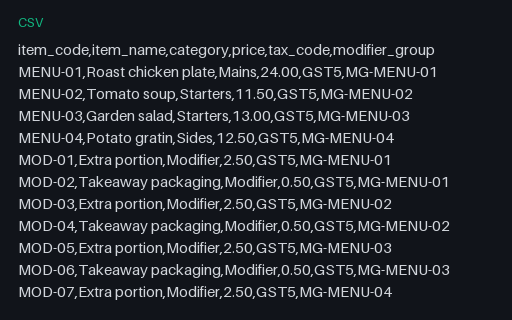
Till import for Alder Table Bistro. 21 rows and 6 columns in the shape a point of sale ingests: item_code, item_name, category, price, tax_code, modifier_group. 4 dishes, 8 modifier options across 4 groups, 8 drink lines and one stored value line. Item codes are letter prefixed so a spreadsheet cannot eat a leading zero, and two tax codes are present so a mapping has something to map.
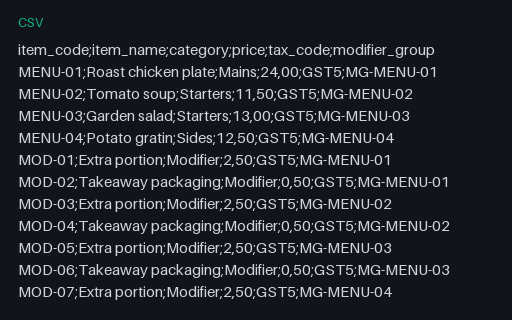
Till import in the European dialect for Alder Table Bistro. The same 21 rows as pos-import.csv in the other dialect a till exports: semicolon delimited, decimal comma in the price column, Latin-1 encoded and CRLF terminated. It carries the non-ASCII characters "é", so reading it as UTF-8 raises a decode error instead of silently producing mojibake.
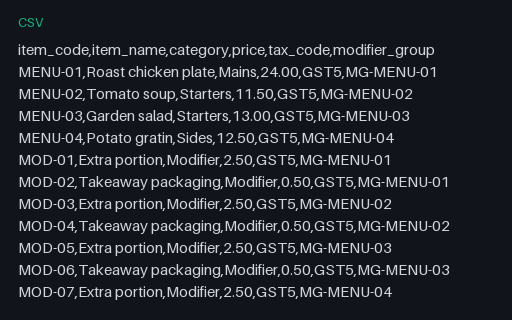
Till import with a duplicate item code for Alder Table Bistro. Intentionally invalid. 22 rows where pos-import.csv has 21. item_code MENU-02 appears on line 3 at 11.50 CAD and again on line 23 at 12.50 CAD, which is the proposed price in the shared menu_price_changes table. It is the only repeated code in the file, so an importer that keeps the last row it reads silently ships the later price.
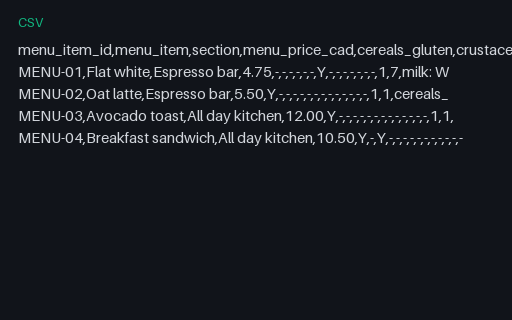
Allergen menu as data for Juniper Corner Cafe. 4 rows and 21 columns: the menu item id, the printed section, the menu price, the 14 allergen columns, the declared count and the ingredient sources. 4 of 4 dishes declare at least one allergen. Joins to printed-menu.pdf and to plate-costs.csv on menu_item_id.
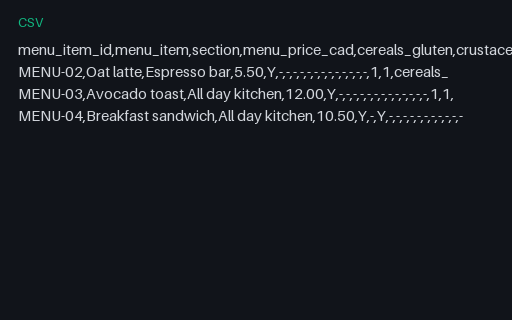
Allergen menu missing a dish on the menu for Juniper Corner Cafe. Intentionally incomplete. 3 rows where allergen-menu.csv has 4. MENU-01 Flat white is printed on printed-menu.pdf at 4.75 CAD and declares 1 allergen in the costing folder, and it has no row here. The remaining rows are correct.
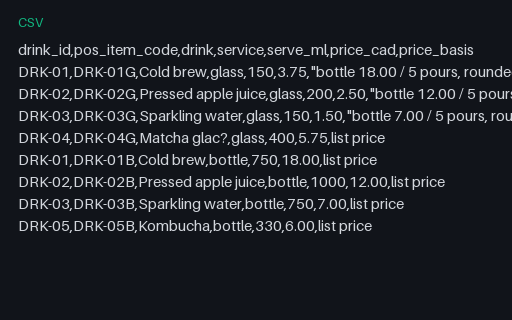
Drinks list as data for Juniper Corner Cafe. 8 rows and 7 columns pairing every printed drink line with the till item code it imports as, the serve size in millilitres and the basis of its price. The three drinks sold both ways appear twice, once per service.
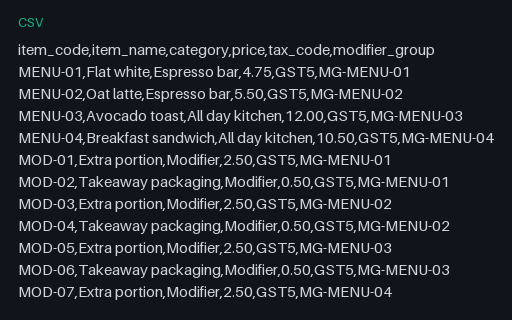
Till import for Juniper Corner Cafe. 21 rows and 6 columns in the shape a point of sale ingests: item_code, item_name, category, price, tax_code, modifier_group. 4 dishes, 8 modifier options across 4 groups, 8 drink lines and one stored value line. Item codes are letter prefixed so a spreadsheet cannot eat a leading zero, and two tax codes are present so a mapping has something to map.
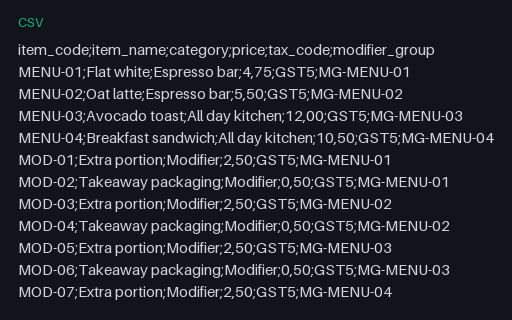
Till import in the European dialect for Juniper Corner Cafe. The same 21 rows as pos-import.csv in the other dialect a till exports: semicolon delimited, decimal comma in the price column, Latin-1 encoded and CRLF terminated. It carries the non-ASCII characters "é", so reading it as UTF-8 raises a decode error instead of silently producing mojibake.
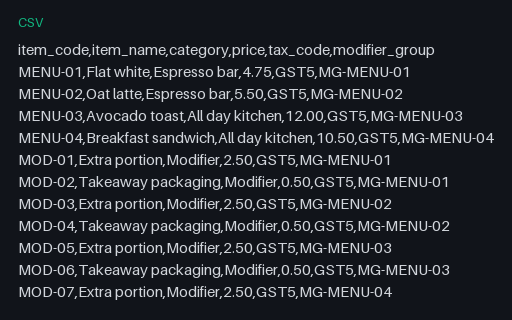
Till import with a duplicate item code for Juniper Corner Cafe. Intentionally invalid. 22 rows where pos-import.csv has 21. item_code MENU-02 appears on line 3 at 5.50 CAD and again on line 23 at 6.50 CAD, which is the proposed price in the shared menu_price_changes table. It is the only repeated code in the file, so an importer that keeps the last row it reads silently ships the later price.
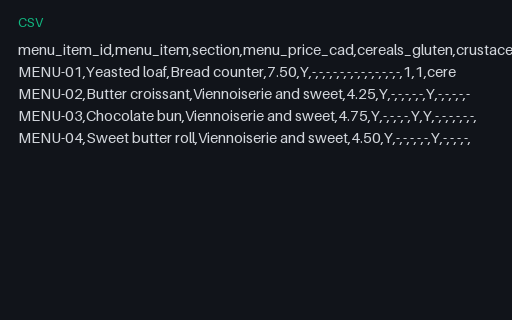
Allergen menu as data for Copper Oven Bakery. 4 rows and 21 columns: the menu item id, the printed section, the menu price, the 14 allergen columns, the declared count and the ingredient sources. 4 of 4 dishes declare at least one allergen. Joins to printed-menu.pdf and to plate-costs.csv on menu_item_id.
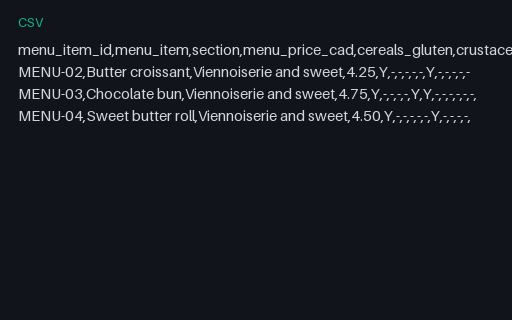
Allergen menu missing a dish on the menu for Copper Oven Bakery. Intentionally incomplete. 3 rows where allergen-menu.csv has 4. MENU-01 Yeasted loaf is printed on printed-menu.pdf at 7.50 CAD and declares 1 allergen in the costing folder, and it has no row here. The remaining rows are correct.
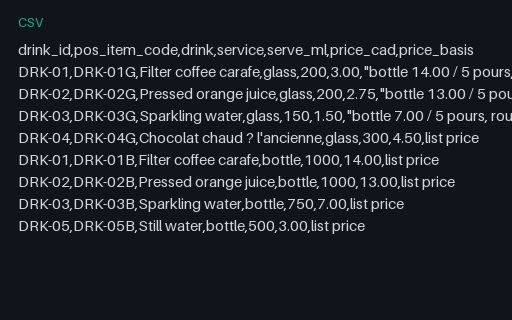
Drinks list as data for Copper Oven Bakery. 8 rows and 7 columns pairing every printed drink line with the till item code it imports as, the serve size in millilitres and the basis of its price. The three drinks sold both ways appear twice, once per service.
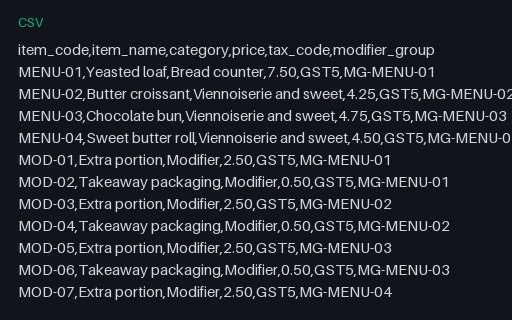
Till import for Copper Oven Bakery. 21 rows and 6 columns in the shape a point of sale ingests: item_code, item_name, category, price, tax_code, modifier_group. 4 dishes, 8 modifier options across 4 groups, 8 drink lines and one stored value line. Item codes are letter prefixed so a spreadsheet cannot eat a leading zero, and two tax codes are present so a mapping has something to map.
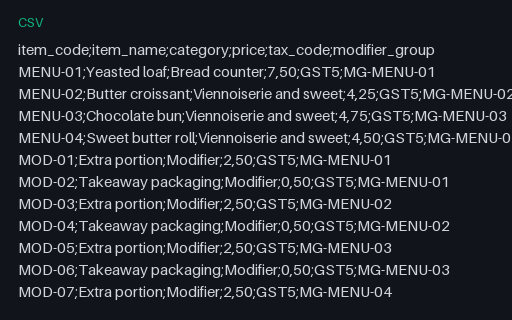
Till import in the European dialect for Copper Oven Bakery. The same 21 rows as pos-import.csv in the other dialect a till exports: semicolon delimited, decimal comma in the price column, Latin-1 encoded and CRLF terminated. It carries the non-ASCII characters "à", so reading it as UTF-8 raises a decode error instead of silently producing mojibake.
Till import with a duplicate item code for Copper Oven Bakery. Intentionally invalid. 22 rows where pos-import.csv has 21. item_code MENU-02 appears on line 3 at 4.25 CAD and again on line 23 at 5.25 CAD, which is the proposed price in the shared menu_price_changes table. It is the only repeated code in the file, so an importer that keeps the last row it reads silently ships the later price.
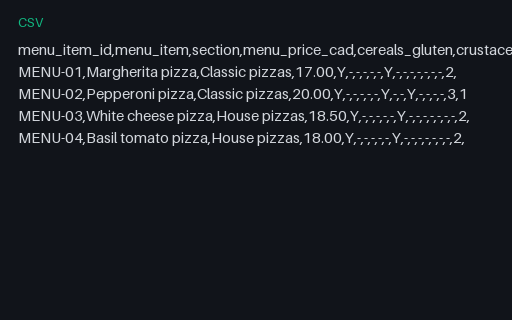
Allergen menu as data for Ember Lane Pizza. 4 rows and 21 columns: the menu item id, the printed section, the menu price, the 14 allergen columns, the declared count and the ingredient sources. 4 of 4 dishes declare at least one allergen. Joins to printed-menu.pdf and to plate-costs.csv on menu_item_id.
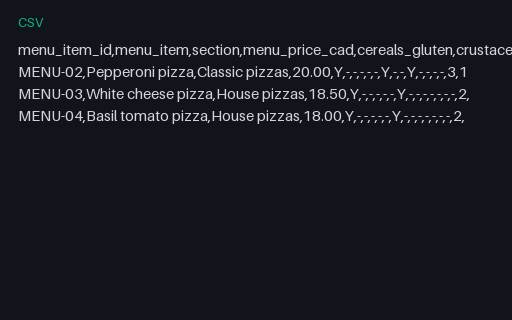
Allergen menu missing a dish on the menu for Ember Lane Pizza. Intentionally incomplete. 3 rows where allergen-menu.csv has 4. MENU-01 Margherita pizza is printed on printed-menu.pdf at 17.00 CAD and declares 2 allergens in the costing folder, and it has no row here. The remaining rows are correct.
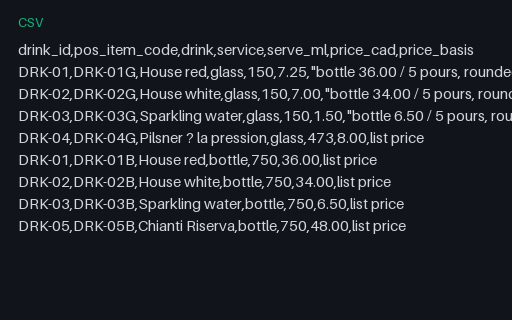
Drinks list as data for Ember Lane Pizza. 8 rows and 7 columns pairing every printed drink line with the till item code it imports as, the serve size in millilitres and the basis of its price. The three drinks sold both ways appear twice, once per service.
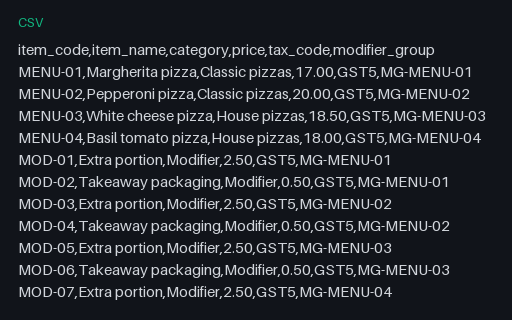
Till import for Ember Lane Pizza. 21 rows and 6 columns in the shape a point of sale ingests: item_code, item_name, category, price, tax_code, modifier_group. 4 dishes, 8 modifier options across 4 groups, 8 drink lines and one stored value line. Item codes are letter prefixed so a spreadsheet cannot eat a leading zero, and two tax codes are present so a mapping has something to map.
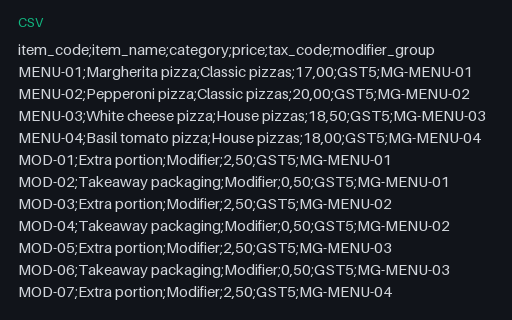
Till import in the European dialect for Ember Lane Pizza. The same 21 rows as pos-import.csv in the other dialect a till exports: semicolon delimited, decimal comma in the price column, Latin-1 encoded and CRLF terminated. It carries the non-ASCII characters "à", so reading it as UTF-8 raises a decode error instead of silently producing mojibake.
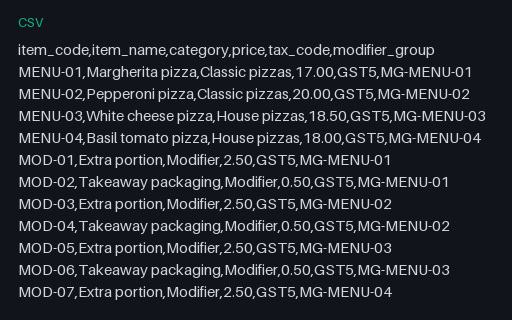
Till import with a duplicate item code for Ember Lane Pizza. Intentionally invalid. 22 rows where pos-import.csv has 21. item_code MENU-02 appears on line 3 at 20.00 CAD and again on line 23 at 21.00 CAD, which is the proposed price in the shared menu_price_changes table. It is the only repeated code in the file, so an importer that keeps the last row it reads silently ships the later price.
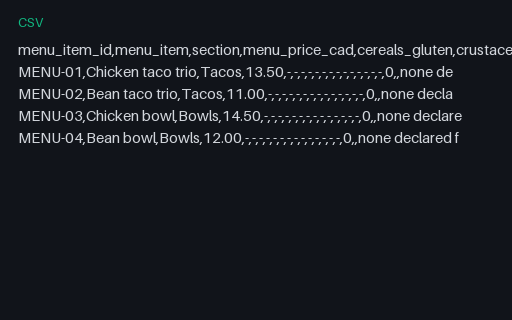
Allergen menu as data for Cedar Street Tacos. 4 rows and 21 columns: the menu item id, the printed section, the menu price, the 14 allergen columns, the declared count and the ingredient sources. 0 of 4 dishes declare at least one allergen. Joins to printed-menu.pdf and to plate-costs.csv on menu_item_id.
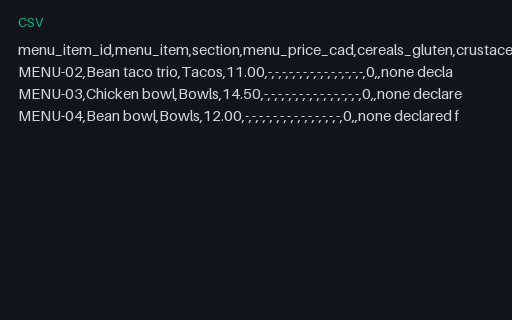
Allergen menu missing a dish on the menu for Cedar Street Tacos. Intentionally incomplete. 3 rows where allergen-menu.csv has 4. MENU-01 Chicken taco trio is printed on printed-menu.pdf at 13.50 CAD and declares 0 allergens in the costing folder, and it has no row here. The remaining rows are correct.
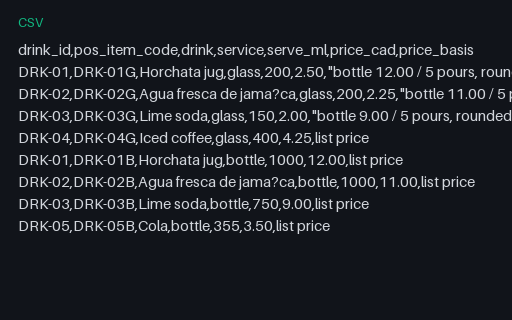
Drinks list as data for Cedar Street Tacos. 8 rows and 7 columns pairing every printed drink line with the till item code it imports as, the serve size in millilitres and the basis of its price. The three drinks sold both ways appear twice, once per service.
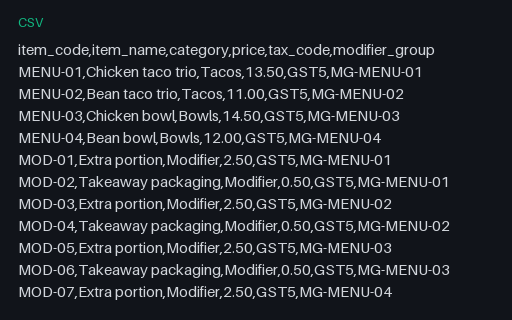
Till import for Cedar Street Tacos. 21 rows and 6 columns in the shape a point of sale ingests: item_code, item_name, category, price, tax_code, modifier_group. 4 dishes, 8 modifier options across 4 groups, 8 drink lines and one stored value line. Item codes are letter prefixed so a spreadsheet cannot eat a leading zero, and two tax codes are present so a mapping has something to map.
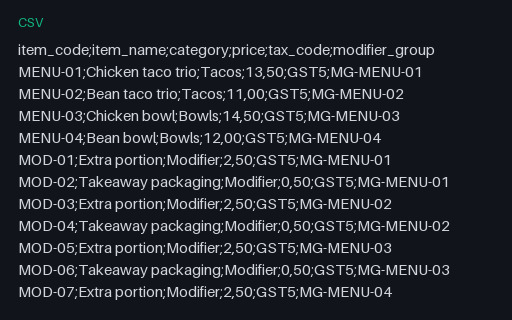
Till import in the European dialect for Cedar Street Tacos. The same 21 rows as pos-import.csv in the other dialect a till exports: semicolon delimited, decimal comma in the price column, Latin-1 encoded and CRLF terminated. It carries the non-ASCII characters "ï", so reading it as UTF-8 raises a decode error instead of silently producing mojibake.
Till import with a duplicate item code for Cedar Street Tacos. Intentionally invalid. 22 rows where pos-import.csv has 21. item_code MENU-02 appears on line 3 at 11.00 CAD and again on line 23 at 12.00 CAD, which is the proposed price in the shared menu_price_changes table. It is the only repeated code in the file, so an importer that keeps the last row it reads silently ships the later price.
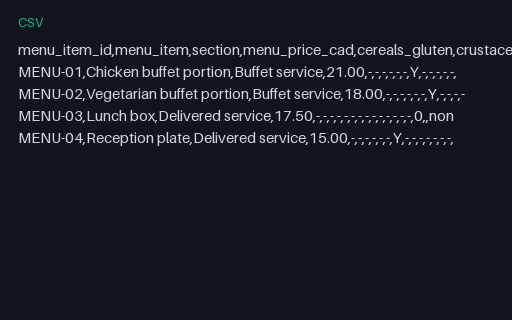
Allergen menu as data for Willow Event Kitchen. 4 rows and 21 columns: the menu item id, the printed section, the menu price, the 14 allergen columns, the declared count and the ingredient sources. 3 of 4 dishes declare at least one allergen. Joins to printed-menu.pdf and to plate-costs.csv on menu_item_id.
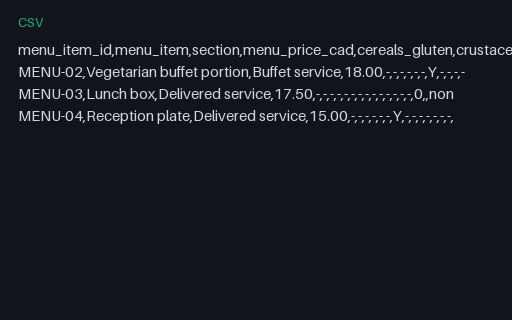
Allergen menu missing a dish on the menu for Willow Event Kitchen. Intentionally incomplete. 3 rows where allergen-menu.csv has 4. MENU-01 Chicken buffet portion is printed on printed-menu.pdf at 21.00 CAD and declares 1 allergen in the costing folder, and it has no row here. The remaining rows are correct.
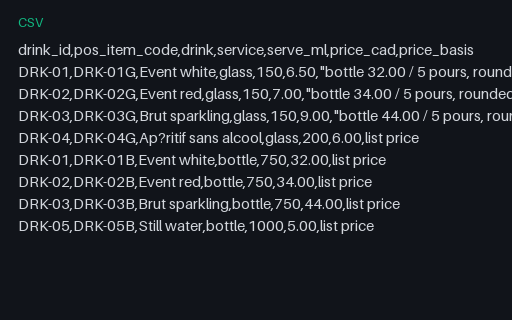
Drinks list as data for Willow Event Kitchen. 8 rows and 7 columns pairing every printed drink line with the till item code it imports as, the serve size in millilitres and the basis of its price. The three drinks sold both ways appear twice, once per service.
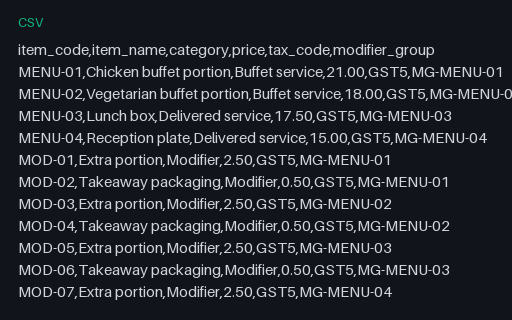
Till import for Willow Event Kitchen. 21 rows and 6 columns in the shape a point of sale ingests: item_code, item_name, category, price, tax_code, modifier_group. 4 dishes, 8 modifier options across 4 groups, 8 drink lines and one stored value line. Item codes are letter prefixed so a spreadsheet cannot eat a leading zero, and two tax codes are present so a mapping has something to map.
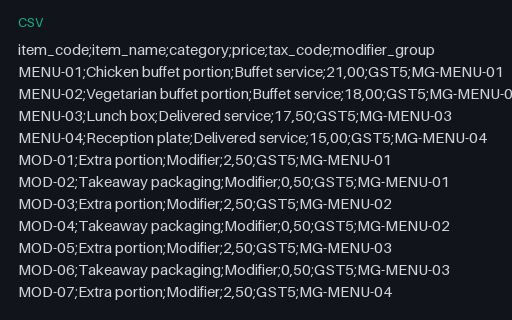
Till import in the European dialect for Willow Event Kitchen. The same 21 rows as pos-import.csv in the other dialect a till exports: semicolon delimited, decimal comma in the price column, Latin-1 encoded and CRLF terminated. It carries the non-ASCII characters "é", so reading it as UTF-8 raises a decode error instead of silently producing mojibake.
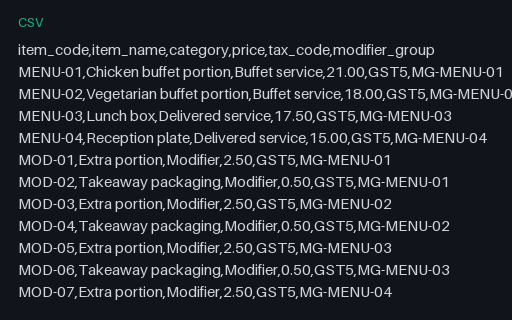
Till import with a duplicate item code for Willow Event Kitchen. Intentionally invalid. 22 rows where pos-import.csv has 21. item_code MENU-02 appears on line 3 at 18.00 CAD and again on line 23 at 19.00 CAD, which is the proposed price in the shared menu_price_changes table. It is the only repeated code in the file, so an importer that keeps the last row it reads silently ships the later price.
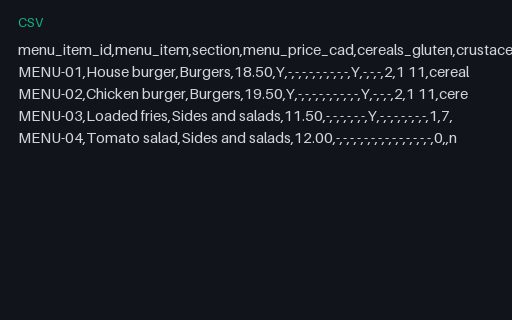
Allergen menu as data for Harbour Kitchen Group. 4 rows and 21 columns: the menu item id, the printed section, the menu price, the 14 allergen columns, the declared count and the ingredient sources. 3 of 4 dishes declare at least one allergen. Joins to printed-menu.pdf and to plate-costs.csv on menu_item_id.
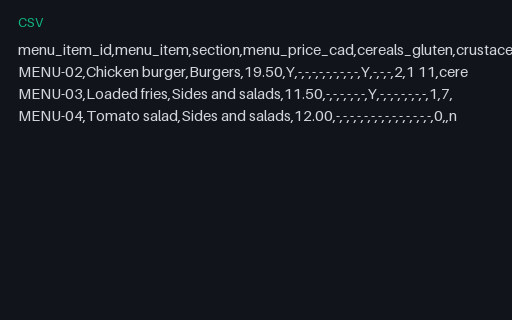
Allergen menu missing a dish on the menu for Harbour Kitchen Group. Intentionally incomplete. 3 rows where allergen-menu.csv has 4. MENU-01 House burger is printed on printed-menu.pdf at 18.50 CAD and declares 2 allergens in the costing folder, and it has no row here. The remaining rows are correct.
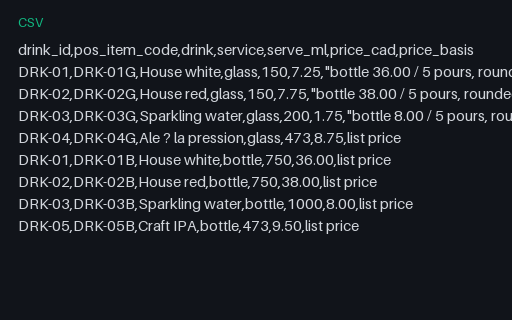
Drinks list as data for Harbour Kitchen Group. 8 rows and 7 columns pairing every printed drink line with the till item code it imports as, the serve size in millilitres and the basis of its price. The three drinks sold both ways appear twice, once per service.
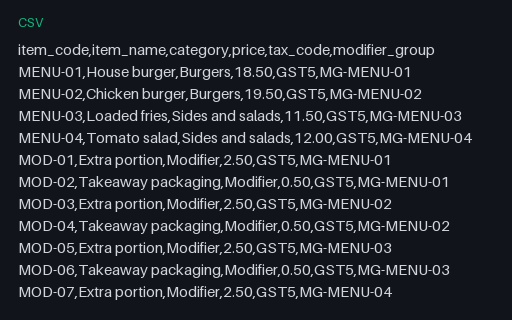
Till import for Harbour Kitchen Group. 21 rows and 6 columns in the shape a point of sale ingests: item_code, item_name, category, price, tax_code, modifier_group. 4 dishes, 8 modifier options across 4 groups, 8 drink lines and one stored value line. Item codes are letter prefixed so a spreadsheet cannot eat a leading zero, and two tax codes are present so a mapping has something to map.
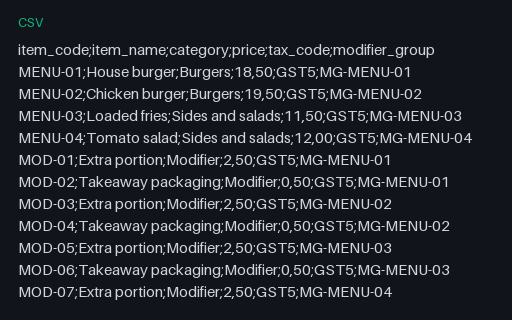
Till import in the European dialect for Harbour Kitchen Group. The same 21 rows as pos-import.csv in the other dialect a till exports: semicolon delimited, decimal comma in the price column, Latin-1 encoded and CRLF terminated. It carries the non-ASCII characters "à", so reading it as UTF-8 raises a decode error instead of silently producing mojibake.
Till import with a duplicate item code for Harbour Kitchen Group. Intentionally invalid. 22 rows where pos-import.csv has 21. item_code MENU-02 appears on line 3 at 19.50 CAD and again on line 23 at 20.50 CAD, which is the proposed price in the shared menu_price_changes table. It is the only repeated code in the file, so an importer that keeps the last row it reads silently ships the later price.
Contract register for Tern Client Services. 11 agreements across five document types with their effective dates, terms, expiry dates, notice deadlines and values. The three rows whose value_basis is "not to exceed" sum to 9,000.00 USD, the liability cap the master agreement states at clause 10.2. 2 rows carry an empty value because the document has no monetary value, and 2 carry an empty file because no rendering of that contractor agreement ships in this set.
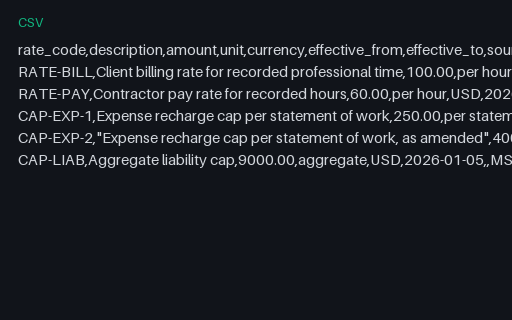
Rate card and caps for Tern Client Services. 5 priced terms drawn from the agreements in this set: the 100.00 USD client billing rate, the 60.00 USD contractor pay rate, both expense caps with the dates that separate them, and the 9,000.00 USD liability cap. Every row names the clause it comes from.
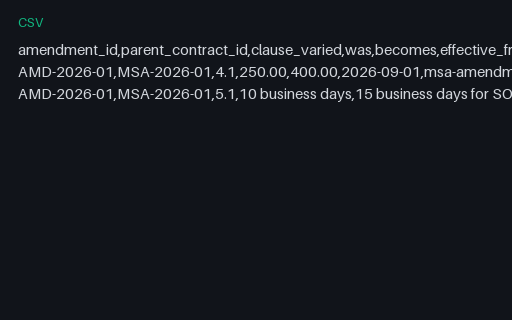
Amendment register for Tern Client Services. Two rows, one per varied clause, each carrying the previous value and the new one so a reader can reconstruct the agreement as it stood on any date. Clause 4.1 moves from 250.00 to 400.00 and clause 5.1 from ten to fifteen business days for one statement of work only.
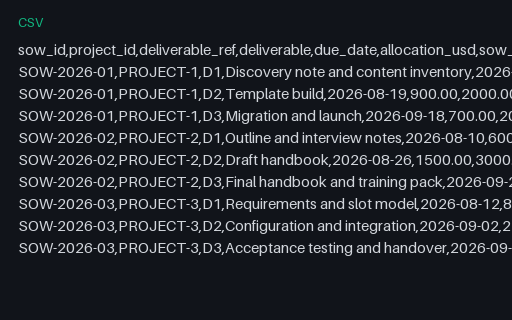
Statement of work deliverables for Tern Client Services. 9 deliverables across the three statements of work, each with a due date, an allocation, the not-to-exceed value of its own statement of work and a single testable acceptance criterion. Grouped by sow_id the allocations sum to exactly 2000.00, 3000.00 and 4000.00, matching the sow_not_to_exceed_usd column on every row of the group. Two rows are marked accepted on 2026-08-24 and carry an accepted_date; the other seven have an empty accepted_date.
Statement of work deliverables with an allocation that does not add up for Tern Client Services. The same 9 rows as sow-deliverables.csv with one number changed: the SOW-2026-03 D2 allocation is 2150.00 instead of 2200.00. The three SOW-2026-03 allocations therefore sum to 3950.00 against the 4000.00 that every row of that group states as sow_not_to_exceed_usd, a shortfall of 50.00 USD. The other two statements of work still balance exactly.
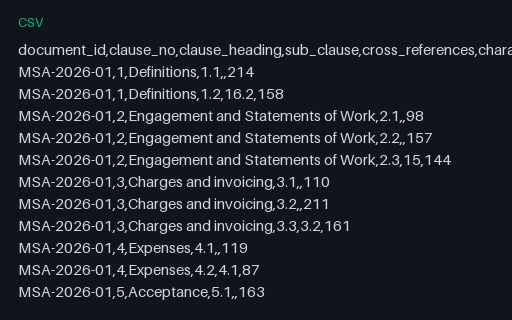
Clause index for Tern Client Services. Every sub-clause of the three agreements in this set as one row: 57 rows across 3 documents, with the clause number, the heading it sits under, the clauses it refers to and its character count. 16 rows carry at least one cross-reference and every one of those resolves to a clause that exists in the same document.
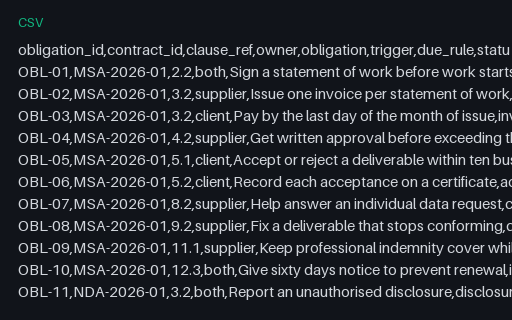
Obligation register for Tern Client Services. 14 obligations pulled out of the three agreements, each naming the contract, the exact clause it comes from, who owns it, what triggers it and when it falls due. Every clause_ref resolves to a row of contract-clause-index.csv.
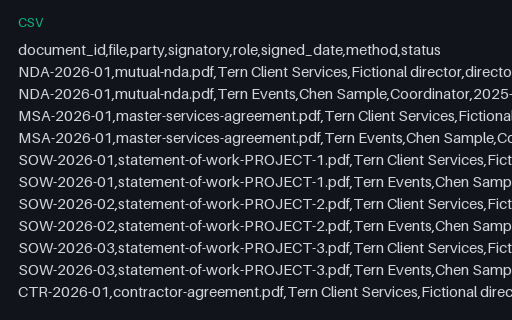
Execution and signature log for Tern Client Services. 19 signature rows covering every executed document in this set. 2 rows have an empty signed_date and an empty method because the counterparty has not signed yet, and their status column says so, so a reader that treats an empty date as a parse failure and one that treats it as unsigned reach different conclusions about the same file.
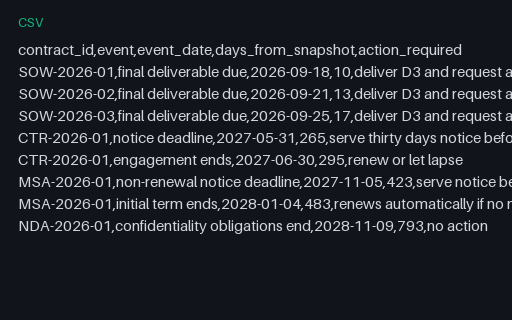
Renewal and notice diary for Tern Client Services. 8 dated events in ascending order, each with the number of days from the fixed snapshot of 2026-09-08. The first is 2026-09-18 at 10 days and the last is 2028-11-09 at 793 days. Every date also appears in contract-register.csv, so the diary can be rebuilt from the register and compared.
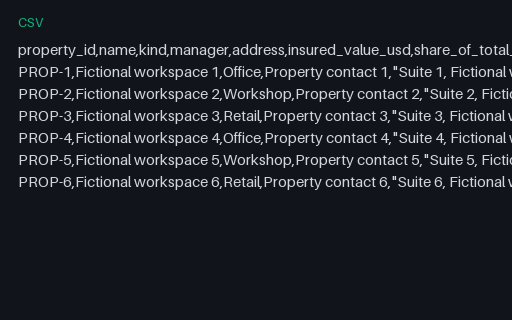
Schedule of insured locations for Pine Property Services. The 6 scheduled properties with their insured values and each one share of the 2,700,000.00 USD total. The share column is apportioned by largest remainder at four decimal places, so the six shares sum to exactly 100.0000 rather than to 100.0002, which is what rounding each share independently produces.
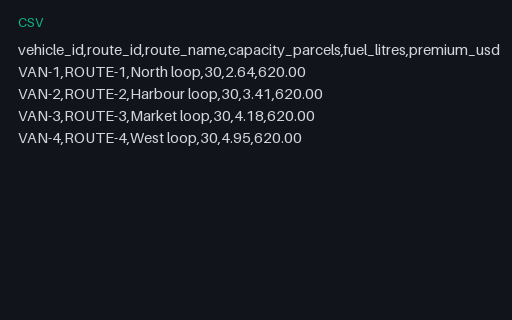
Schedule of insured vehicles for Pine Property Services. The 4 scheduled vehicles with the delivery route each is assigned to and a flat 620.00 USD premium each, which is the 2,480.00 USD commercial auto line on the policy schedule. The vehicle and route identifiers are the ones the inventory-manufacturing model holds.
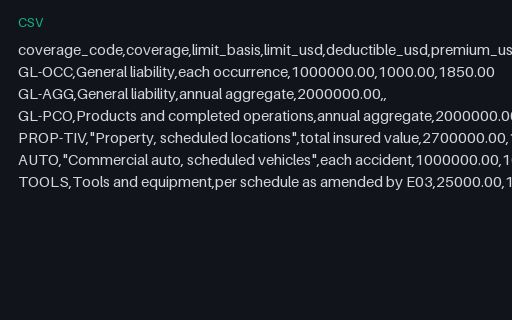
Coverage limits for Pine Property Services. 6 coverage lines. Three of them carry an empty premium_usd because they are sub-limits of the general liability premium rather than separately rated, and the four rows that do carry a premium sum to the 7,040.00 USD base premium on the policy schedule.
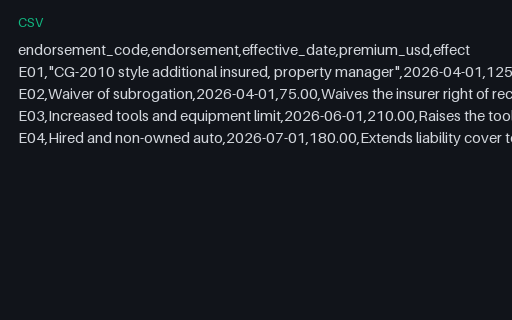
Endorsement schedule for Pine Property Services. 4 endorsements with their effective dates and premiums. Two attach at inception and two mid-term, and the four premiums sum to 590.00 USD, the endorsement line of the premium breakdown. E01 and E02 are the two a certificate of insurance has to reflect, and the certificate register carries a column for each.
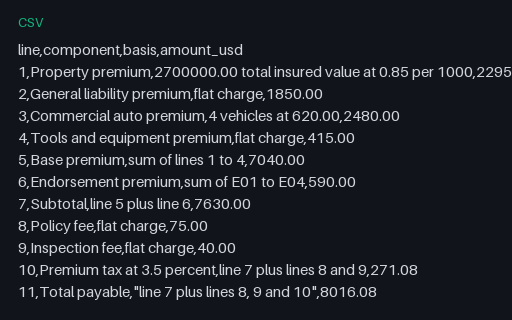
Premium breakdown for Pine Property Services. The full premium chain in 11 numbered lines, each stating the basis it is computed from, so every subtotal can be recomputed from the lines above it. Line 1 is 2700000.00 of insured value at 0.85 per 1000, which is 2295.00; line 11 is 8016.08 USD.
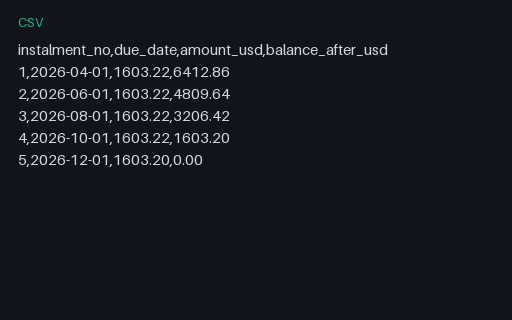
Premium instalment schedule for Pine Property Services. 5 instalments with a running balance that starts at 8,016.08 USD and reaches exactly 0.00 on the last row. The first 4 are 1603.22 and the last is 1603.20, because 8,016.08 divided by 5 does not land on a whole cent and the remainder is taken off the final instalment.
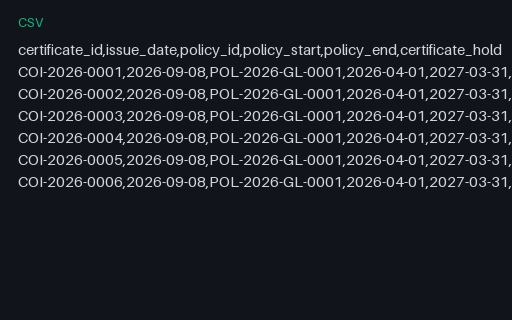
Certificate of insurance register for Pine Property Services. 6 certificates, one per scheduled property, all issued 2026-09-08 against policy POL-2026-GL-0001 and all expiring 2027-03-31. days_until_expiry is 204 on every row, which is policy_end minus issue_date, and every row is positive because every certificate was issued while its cover was live.
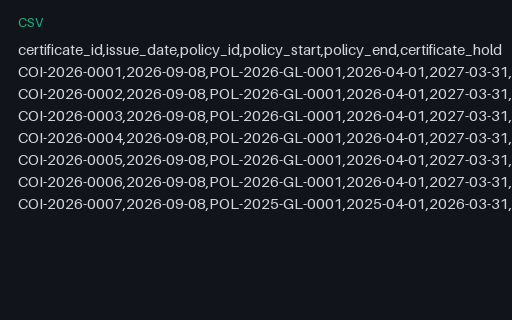
Certificate register with a certificate that expired before it was issued for Pine Property Services. The same 6 valid rows with a seventh added: COI-2026-0007 is issued 2026-09-08 against a policy period that ended 2026-03-31, 161 days earlier, and its days_until_expiry cell reads -161. The row is internally consistent, so the arithmetic check passes and only the business rule that a certificate cannot be issued after its cover ends catches it. Its status still says in force.
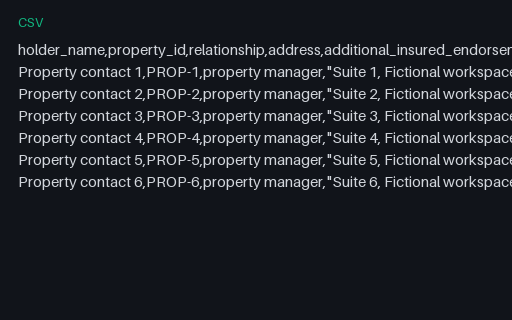
Certificate holder register for Pine Property Services. The 6 parties who require a certificate, each naming the endorsement that makes them an additional insured and the endorsement that waives subrogation. Every holder appears exactly once in certificate-of-insurance-register.csv.
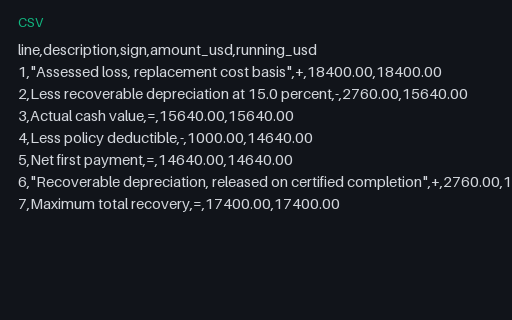
Claim settlement lines for Pine Property Services. The same seven lines as the settlement statement with the sign held in its own column rather than embedded in the amount, so amounts are all positive and a reader has to apply the sign to reproduce the running balance. Applying the signs in order reproduces every running value and ends at 17400.00.
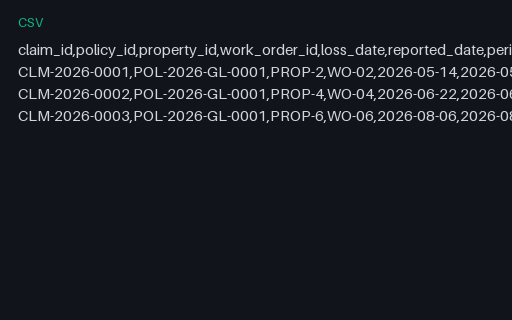
Claim register for Pine Property Services. 3 claims against policy POL-2026-GL-0001, each joined to the work order and property the trades-property model holds. incurred_usd is paid_usd plus reserve_usd on every row; the three rows sum to 17,890.00 paid, 2,760.00 reserved and 20,650.00 incurred. One claim closed without payment because it was assessed below the 1,000.00 USD deductible.
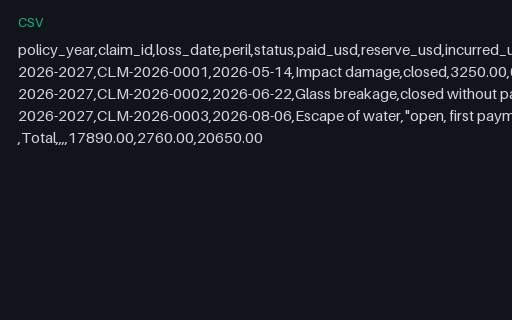
Loss run report for Pine Property Services. The policy-year loss run: 3 claims with a total row. Paid 17,890.00, reserved 2,760.00, incurred 20,650.00 USD against an earned premium of 3,344.66 USD at the 2026-09-08 snapshot, a loss ratio of 617.4 percent. Earned premium is the 7,630.00 USD subtotal, excluding fees and tax, for the 160 days of the 365 day policy period that have elapsed.
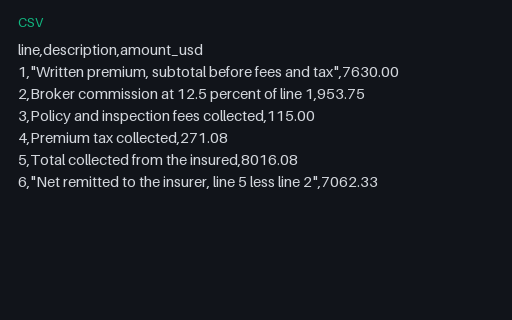
Broker account statement for Pine Property Services. The broker side of the same premium: 7,630.00 USD of written premium, 12.5 percent commission of 953.75 USD, and 7,062.33 USD remitted to the insurer out of the 8,016.08 USD collected. Commission is charged on the subtotal only, not on the fees or the tax, which is why line 2 is not a percentage of line 5.
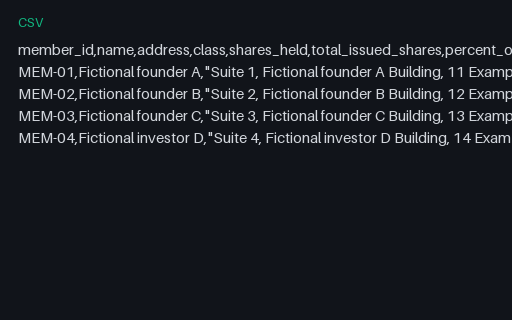
Register of members for Juniper Workspace Cloud. The 4 members with their holdings, certificate numbers and amounts paid. shares_held sums to 600,000, which is the total_issued_shares value every row carries, and percent_of_issued sums to exactly 100.0000. amount_paid_usd sums to 20,400.00 USD, which is the 6,000.00 USD of nominal capital plus the 14,400.00 USD share premium from the 2026-05-18 allotment.
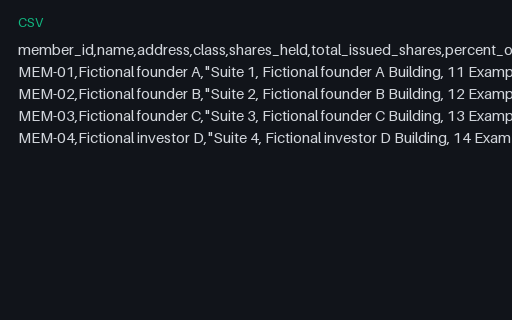
Register of members whose holdings do not add up to the issued capital for Juniper Workspace Cloud. The same 4 members with one number changed: MEM-03 holds 59,500 shares instead of 60,000. shares_held now sums to 599,500 against the 600,000 that every row still declares as total_issued_shares, a shortfall of 500 shares, 5.00 USD of nominal capital. percent_of_issued and amount_paid_usd are untouched, so three columns of the same row now disagree with each other.
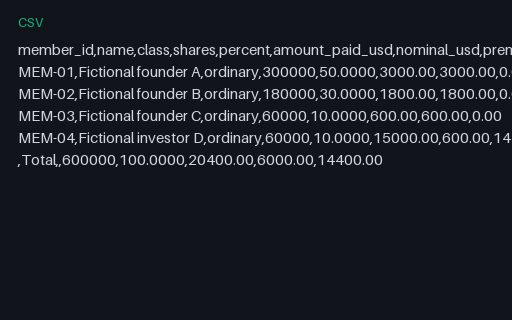
Capitalisation table for Juniper Workspace Cloud. The 4 holdings split into nominal and premium with a total row. Only MEM-04 carries premium, 14,400.00 USD, because only the 2026-05-18 allotment was priced above nominal, at 0.25 against 0.01. The percentages are apportioned by largest remainder and sum to exactly 100.0000.
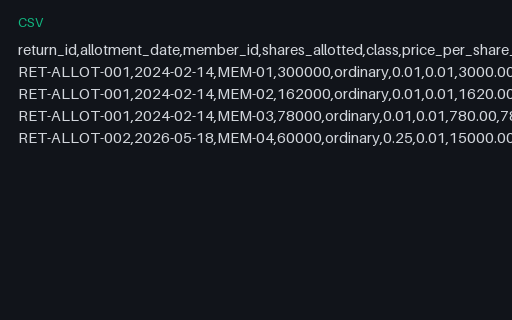
Share allotment return for Juniper Workspace Cloud. 4 allotment rows across two returns. On every row consideration is shares times price and also equals nominal plus premium. The three founding rows are priced at nominal so their premium is 0.00; the 2026-05-18 row is priced at 0.25 against a 0.01 nominal, so 15,000.00 USD of consideration splits into 600.00 nominal and 14,400.00 premium.
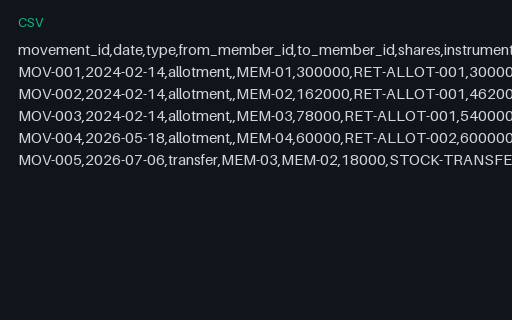
Shareholding movement history for Juniper Workspace Cloud. 5 movements in date order: four allotments that raise the shares in issue to 600,000 and one transfer of 18,000 shares from MEM-03 to MEM-02 that leaves the total unchanged. Replaying the movements from zero reproduces every holding in register-of-members.csv, including the certificate cancellations the transfer caused.
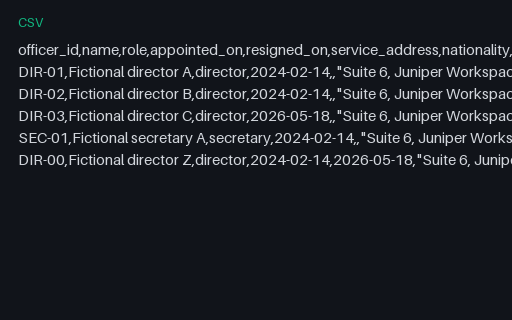
Register of directors and secretaries for Juniper Workspace Cloud. 5 officers of whom 4 are currently in office. One row has a resigned_on date of 2026-05-18 and currently_in_office false; the other four have an empty resigned_on. The same date is the board meeting that appointed the replacement, so the register and the minutes agree.
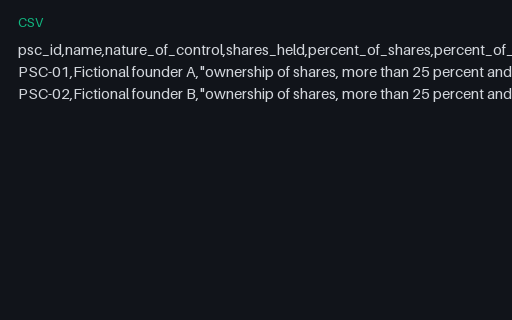
Register of persons with significant control for Juniper Workspace Cloud. The two members holding more than 25 percent of the shares, with their holdings and percentages taken from the register of members. MEM-03 and MEM-04 hold 10.0000 percent each and are correctly absent, so a reader that expects every member to appear here will look for two rows that should not exist.
Register of charges for Juniper Workspace Cloud. Two charges, one satisfied and one outstanding. The outstanding floating charge secures 48,000.00 USD, which is the same principal as the loan facility in the banking set, so the two sets describe the same borrowing from the lender side and the borrower side.
Statutory registers index for Juniper Workspace Cloud. 6 registers with the file that holds each one, the article clause that requires it, the number of entries and the date it was last updated. Every file named exists in this directory and every entry count matches the row count of that file.
Meeting attendance register for Juniper Workspace Cloud. 8 attendance rows across two board meetings. The attended column carries three values, true, false and in attendance, because the secretary attends without being a director and does not count towards the quorum. Both meetings met the quorum of two directors with two and three directors present.
Sales tax filing worksheet for Fieldnote Supply Shop. The 6 jurisdictions this shop collected in during 2026-08-01 to 2026-08-31, taken to the point of remittance. Net tax due sums to 88.88 USD, exactly the figure the wave-one tax-summary.csv reaches by a different route; two jurisdictions allow a vendor collection discount, which takes 0.13 off, so 88.75 USD is actually remitted. 2 rows have an empty permit_number because the two Canadian jurisdictions are filed on the GST/HST return instead.
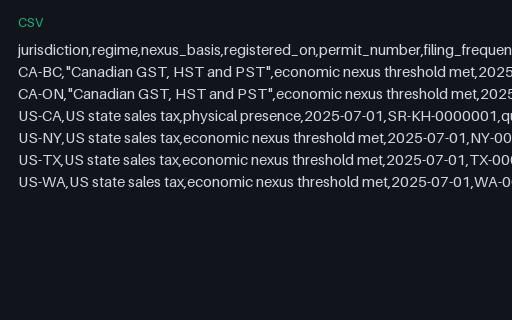
Sales tax nexus summary for Fieldnote Supply Shop. Why the shop is registered in each of the 6 jurisdictions, with the permit, the filing frequency and the next due date. Due dates range from 2026-09-20 to 2026-10-31, so a reader that assumes one filing calendar across a multi-state seller gets four of the six wrong.
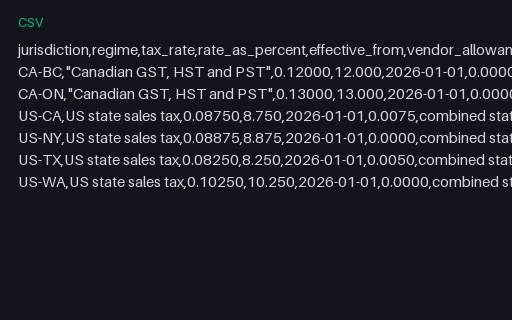
Tax rate table for Fieldnote Supply Shop. The 6 rates as both a decimal and a percentage, so a reader can check one against the other. US-NY at 0.08875 is the one that a float round trip most often damages, and it is carried here to five decimal places and as 8.875 percent.
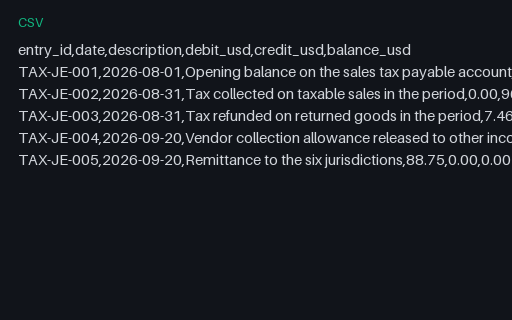
Sales tax payable control account for Fieldnote Supply Shop. The ledger account behind the filing: opening 0.00, credited 96.34 of tax collected, debited 7.46 of tax refunded, leaving 88.88 USD payable at the end of the period. The 0.13 vendor allowance and the 88.75 remittance then clear it to exactly 0.00 on 2026-09-20. The balance after row 3 is the same number the filing worksheet reaches by summing six jurisdictions.
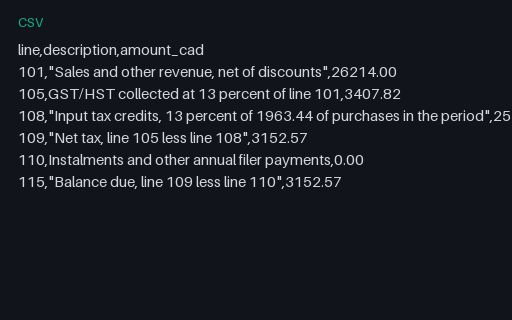
GST/HST return lines for Harbour Kitchen Group. The six return lines as a three-column CSV keyed by the line number the form uses, so a reader can address a value by its line rather than by its position. Line 109 and line 115 both carry 3152.57 CAD because there are no instalments to deduct.
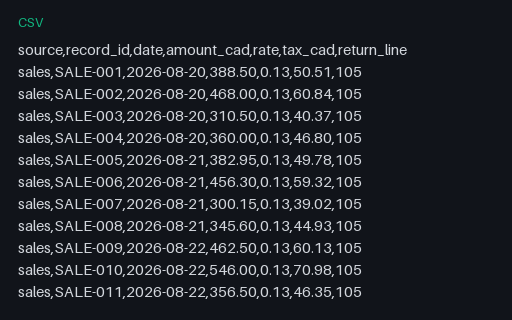
GST/HST return workings for Harbour Kitchen Group. Every source record behind the return: 56 sales rows tagged to line 105 and 24 purchase rows tagged to line 108, 80 rows in all. Taxing each row and adding gives 3407.94 and 255.23, which are 0.12 and -0.02 away from the 3407.82 and 255.25 on the return, because the return taxes the period total once and this file taxes every row and then adds.
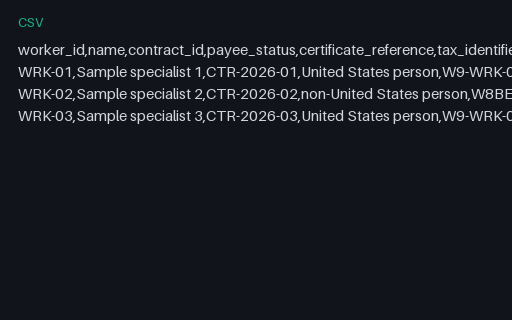
Payee register for Tern Client Services. All 3 contractor payees with the certificate each has on file and the information return each one gets. Payments sum to 4,320.00 USD, which is every recorded hour at 60.00 USD, but they split 2,880.00 to 1099-NEC shaped slips and 1,440.00 to a 1042-S shaped statement, so no single information return file totals the ledger.
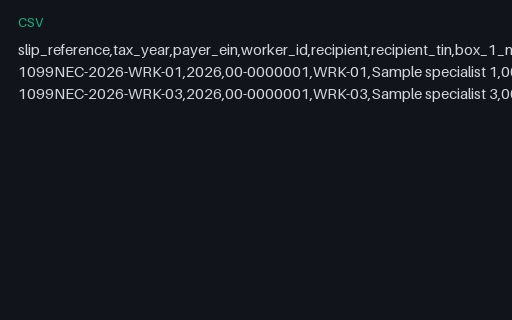
1099-NEC shaped recipient list for Tern Client Services. 2 recipients with every box the slips print. box_1 sums to 2880.00 USD, which is the control_total_box_1 value carried on every row, and the box_6 column is empty on both rows because neither payee has a state identification number. The third contractor is absent by design: WRK-02 files a W-8BEN shaped certificate and is reported on the 1042-S shaped statement.
1099-NEC shaped recipient list whose boxes do not reach the control total for Tern Client Services. The same 2 recipients with one number changed: WRK-03 box_1 reads 1820.00 instead of 1920.00. box_1 now sums to 2780.00 against the 2880.00 that both rows still carry as control_total_box_1, a shortfall of 100.00 USD. box_7 was moved with box_1 so the row stays internally consistent and only the control total catches it.
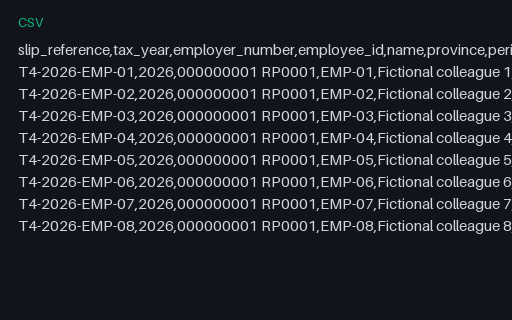
T4 shaped slip register for Harbour Kitchen Group. All 8 slips for the period. Box 14 sums to 9,190.00 CAD, which is the base pay the restaurant model records across every rostered shift, and boxes 16, 18 and 22 sum to 546.82, 152.56 and 1,378.50. Every row net_pay_cad is box 14 less those three, and the eight net figures sum to 7,112.12 CAD.
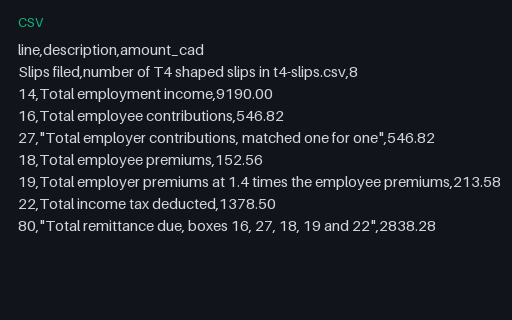
T4 shaped summary lines for Harbour Kitchen Group. The same 8 summary lines as a CSV keyed by the box number, with the slip count on a line whose key is a word rather than a number, so a reader that assumes an integer key on every row has to handle it.
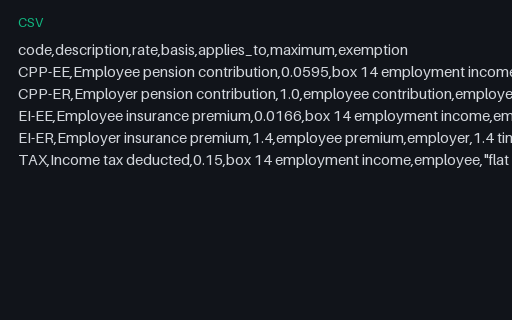
Payroll deduction rates used by the T4 shaped slips for Harbour Kitchen Group. The 5 rates behind every T4 box in this set, with the basis each one is applied to and an explicit statement that no maximum, band or personal exemption is applied. Two rows are multipliers of another row rather than percentages of income, so a reader that treats the rate column as one thing gets the employer lines wrong.
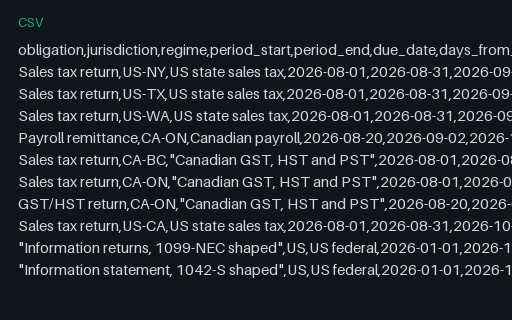
Tax obligation calendar for Fieldnote Supply Shop. 10 dated obligations across four regimes and two currencies, in due date order, each with the days from the fixed snapshot and the amount due. The amount column mixes USD and CAD, so it must not be summed without the currency column: doing so gives a meaningless 10399.60.
Tax reconciliation, source against source for Fieldnote Supply Shop. 7 identities stated as a pair of sources and their values, with the difference computed rather than asserted. Every difference is 0.00, and two of the rows reach across into the wave-one ecommerce set and into the crm-services model, so the file is also a cross-set consistency check.
Loan amortisation schedule for Pine Assembly Workshop. 36 rows with opening balance, payment, interest, capital, closing balance and cumulative interest. Payment equals interest plus capital and closing equals opening less capital on every row. The closing balance on row 36 is exactly 0.00 because the final payment is adjusted to 1479.81, and cumulative interest ends at 5276.66 USD.
Loan amortisation schedule whose final balance does not reach zero for Pine Assembly Workshop. The same 36 months with one number changed: the instalment is 1479.00, the correct 1479.91 rounded down to whole dollars. Every row still satisfies payment equals interest plus capital and closing equals opening less capital, but after the last payment the borrower still owes 36.15 USD instead of 0.00. Cumulative interest ends at 5280.15, which is 3.49 more than the correct schedule, because the balance falls more slowly.
Quarterly interest accrual for Pine Assembly Workshop. The first 4 quarters of the facility rolled up from the monthly schedule. Each row opening balance is the opening balance of the first month in the quarter and each closing is the closing of the last, so closing equals opening less capital repaid and the quarters chain without a gap.
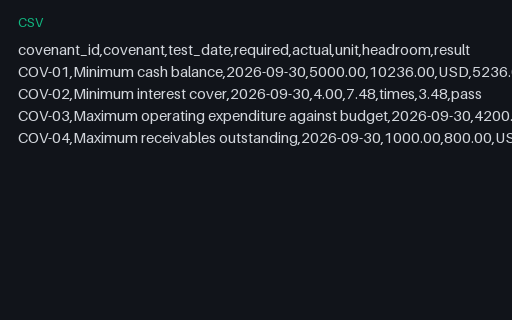
Covenant test schedule for Pine Assembly Workshop. The 4 covenant tests as data, with required, actual and headroom in their own columns and a unit column, because two of the four are money and one is a ratio. Headroom is signed in the direction of compliance, so a minimum covenant and a maximum covenant both show positive headroom when they pass.
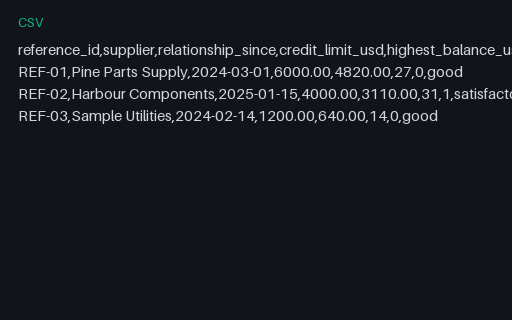
Trade credit references for Alder Books Reconciliation. 3 trade references with credit limits, highest balance reached and average days to pay. Every highest_balance_usd is below its own credit_limit_usd, so a utilisation check passes on all three, and the two supplier names are the suppliers the inventory-manufacturing model actually buys from.
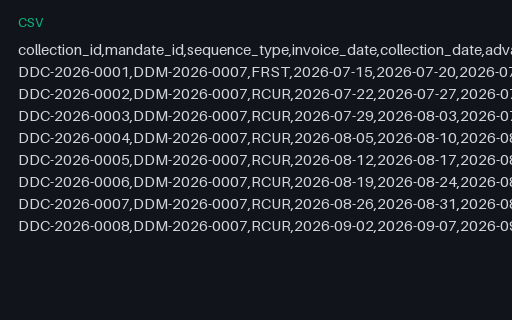
Direct debit collection schedule for Harbour Kitchen Group. 8 collections under mandate DDM-2026-0007, each 5 days after its invoice date with advance notice three days before that. The amounts are the supplier invoice totals the restaurant purchase ledger holds and sum to 4,077.58 CAD. The first collection carries sequence type FRST and the other 7 carry RCUR, which is the distinction a scheme rejects a file for getting wrong.
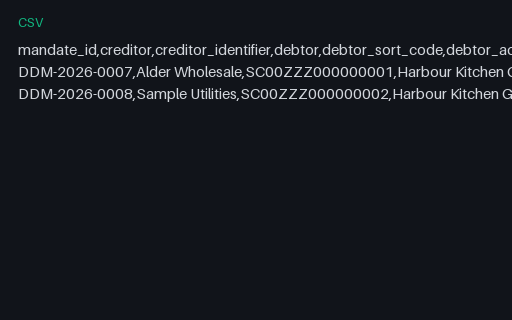
Direct debit mandate register for Harbour Kitchen Group. Two mandates for the same debtor account, one active and one cancelled. The active mandate has taken 8 of its 8 collections by the 2026-09-08 snapshot, 4,077.58 CAD of the 4,077.58 authorised. The cancelled mandate still shows the three collections it took before it was cancelled, because cancelling a mandate does not reverse what it already collected.
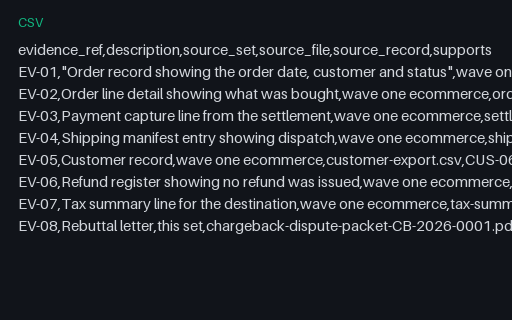
Chargeback evidence index for Fieldnote Supply Shop. 8 evidence items with the file and record each one points at and what it proves. Seven of the eight resolve into the wave-one ecommerce document set by filename and record identifier, so the packet is not a self-contained story but a set of pointers that either resolve or do not.
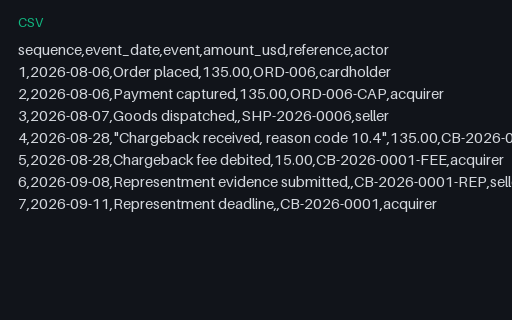
Chargeback timeline for Fieldnote Supply Shop. 7 events in date order from the order on 2026-08-06 to the representment deadline on 2026-09-11. Three rows carry an empty amount because dispatch, evidence submission and a deadline move no money, so a reader that treats the amount column as always numeric has three rows to handle.
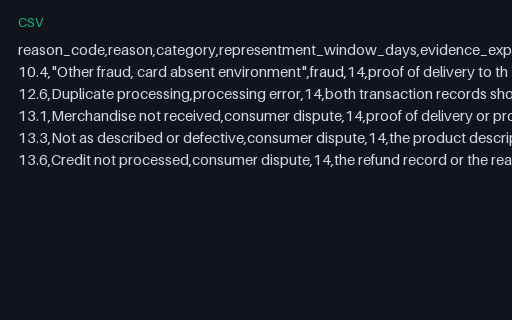
Chargeback reason code reference for Fieldnote Supply Shop. 5 reason codes with the category, the representment window and the evidence each one expects. The two codes the wave-one chargeback register uses, 10.4 and 13.1, are both here, so that register can be joined to this table to find out what evidence each open case needs.
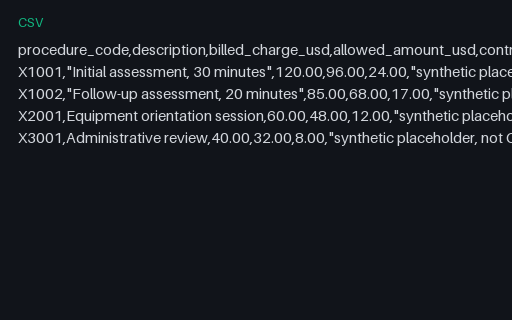
Procedure code table for Juniper Fitness and Clinic Administration. The 4 procedure codes this clinic bills, with the charge, the allowed amount at 80 percent of charge and the contractual adjustment that is the difference. The code_system column says on every row that these are synthetic placeholders in the five-character shape, not values from any real code set.
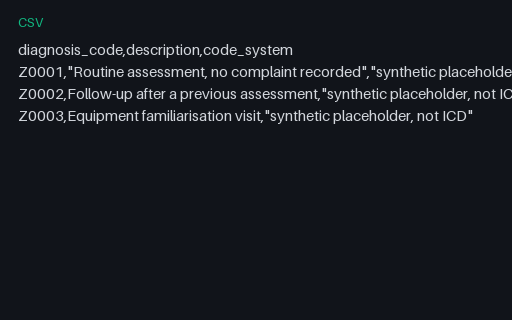
Diagnosis code table for Juniper Fitness and Clinic Administration. The 3 diagnosis codes referenced by the claims, all of them administrative rather than clinical: a routine assessment, a follow-up and an equipment familiarisation visit. Every code is a synthetic placeholder and the table says so in its own column.
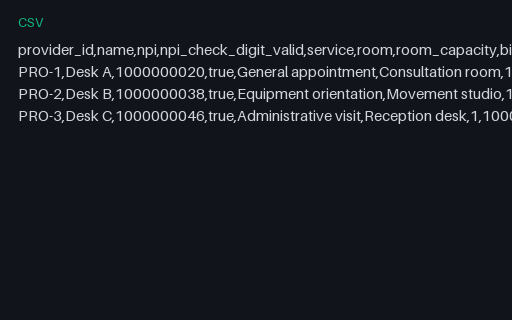
Provider roster for Juniper Fitness and Clinic Administration. The 3 providers with ten-digit identifiers in the national provider identifier shape. Each one carries a real modulo-10 check digit computed over the 80840 prefix and the nine-digit body, so a validator that implements the check digit rule accepts all of them, and the roster records that it did.
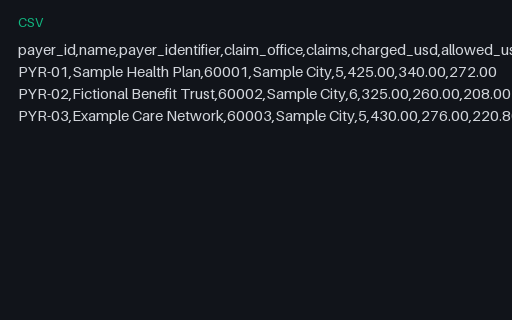
Payer roster for Juniper Fitness and Clinic Administration. The 3 payers with their claim counts and money. Claims sum to 16, charges to 1,180.00 USD, allowed to 876.00 and paid to 700.80, which are the same control totals the remittance and the reconciliation carry.
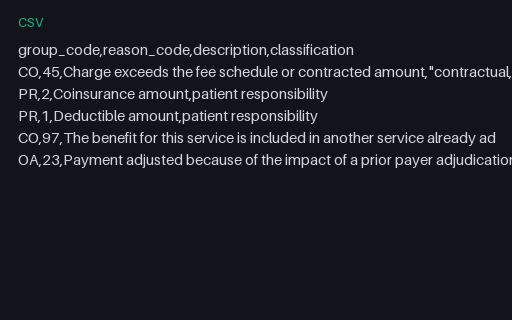
Claim adjustment reason codes for Juniper Fitness and Clinic Administration. The 5 adjustment codes the remittance uses, each with its group code and whether it is contractual, patient responsibility or another adjustment. The distinction matters: a CO adjustment can never be billed to the patient and a PR adjustment is exactly what is billed, so a reader that ignores the group code bills the wrong party.
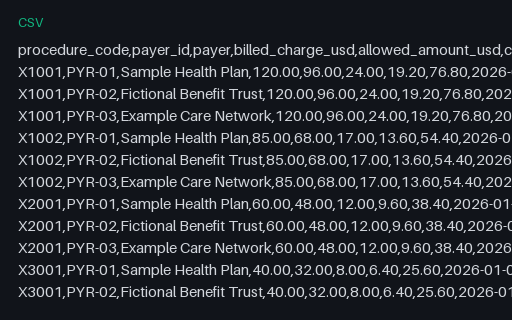
Payer fee schedule for Juniper Fitness and Clinic Administration. 12 rows, every procedure against every payer. All three payers use the same 80 percent allowed rate and the same 20 percent coinsurance, so the schedule is deliberately uniform and any difference a reader finds between payers in the remittance comes from adjudication rather than from pricing.
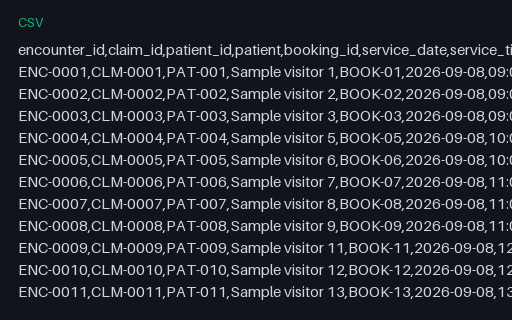
Encounter register for Juniper Fitness and Clinic Administration. 16 encounters, one for each confirmed booking in the appointment model. The two cancelled bookings are absent, so the register has 16 rows where the booking table has 18. Charges sum to 1,180.00 USD across 18 service lines, allowed to 876.00, and the payers paid 700.80 leaving 175.20 with patients.
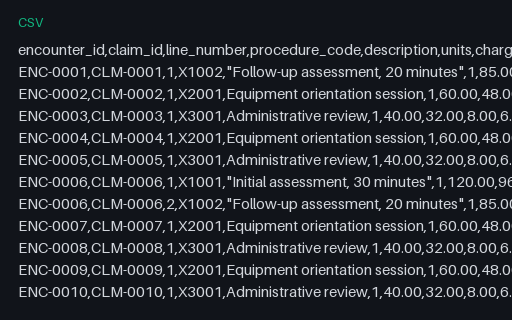
Service line detail for Juniper Fitness and Clinic Administration. All 18 service lines across the 16 encounters. Charges sum to 1,180.00 USD, which is the charge column of encounter-register.csv added, and grouping by claim_id reproduces every claim total exactly. This is the file the 837 service-line total has to agree with.
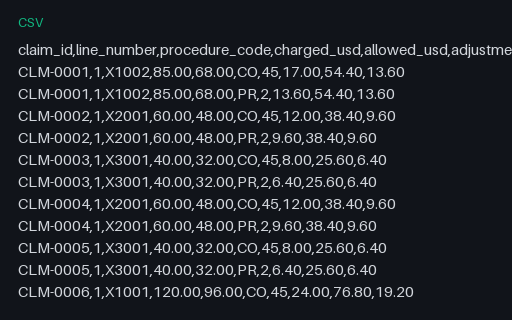
Remittance adjustment lines for Juniper Fitness and Clinic Administration. 35 rows, one per adjustment rather than one per service line, because a paid service line carries two adjustments and a denied one carries a single CO 97. Grouping by adjustment group gives 304.00 USD of CO write-offs and 175.20 USD of PR patient responsibility. Summing the charged column instead double counts, because charged repeats on both adjustment rows of a paid line.
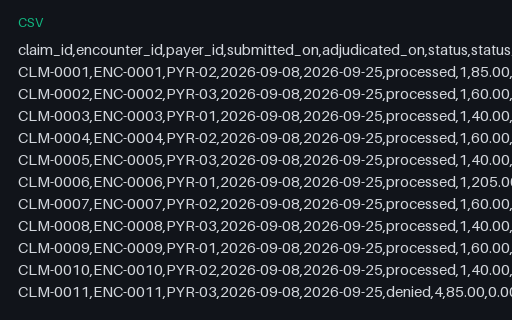
Claim status register for Juniper Fitness and Clinic Administration. All 16 claims with the status code the 835 CLP02 carries, the payer control number and the 17 days between submission and payment. 1 claim is status 4, denied, and the rest are status 1, processed as primary. Every payer control number is unique and appears once in remittance-835.edi.
Denial register for Juniper Fitness and Clinic Administration. The single denied claim, CLM-0011, denied in full for 85.00 USD under CO 97 with a 90 day appeal deadline of 2026-12-24. The group code is CO, so the amount is a contractual write-off and must not be billed to the patient even though nothing was paid, which is exactly the case a reader gets wrong by assuming an unpaid claim becomes a patient balance.
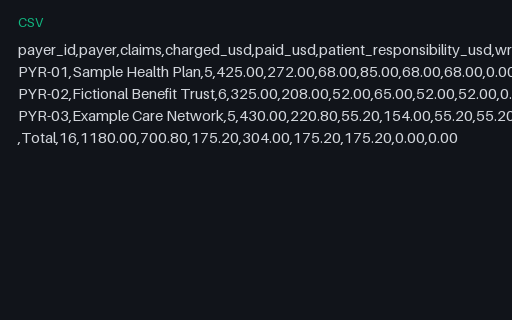
Receivable aging by payer for Juniper Fitness and Clinic Administration. The 3 payers plus a total row. On every row paid plus patient responsibility plus written off equals charged, and the three aging buckets sum to the outstanding column. Nothing is older than thirty days because every claim was paid 17 days after submission, so the whole 175.20 USD outstanding sits in the first bucket and is owed by patients rather than by payers.
Patient roster for Juniper Fitness and Clinic Administration. The 16 patients, which are the fictional visitor names the appointment model already carries, joined to their booking, encounter, claim and payer. Every row carries the same synthetic date of birth of 1900-01-01 and a column that says so, because the X12 claim needs a demographic segment and this set will not hold a plausible personal record to fill it.
Schedule of unit areas for Pine Property Services. The 6 demises in PROP-1 with their floor areas and each one share of the 1200.00 sq m lettable area. Areas sum to the lettable area exactly and the shares sum to exactly 100.0000 percent because they are apportioned by largest remainder. The 185.00 sq m of common parts sits outside this table and is never apportioned, which is why no row accounts for it.
Rent roll for Pine Property Services. The 6 demises with area, rent, passing rent and estimated rental value. Unit areas sum to 1200.00 sq m, which is the building_area_sq_m value every row carries. Passing rent is 245,475.00 USD and estimated rental value 271,475.00, the difference being the 26000.00 USD that U-06 would produce if it were let. Annual rent is area times rate on every row and quarterly rent is a quarter of passing rent.
Rent roll whose unit areas do not sum to the building area for Pine Property Services. The same 6 demises with one number changed: U-03 reads 211.50 sq m instead of 230.00. Unit areas now sum to 1181.50 against the 1200.00 that every row still declares as building_area_sq_m, a shortfall of 18.50 sq m. The rent columns are untouched, so U-03 annual rent no longer equals its area times its rate either, and the two failures are the same mutation seen twice.
Lease abstract for Pine Property Services. The 5 let demises abstracted onto one row each: term, break, review, rent, service charge proportion and deposit. Quarterly rent is a quarter of annual rent and the deposit is two quarters on every row. Only LSE-2026-02 has a break date, so four of the five rows carry an empty break_date and an empty break_notice_by.
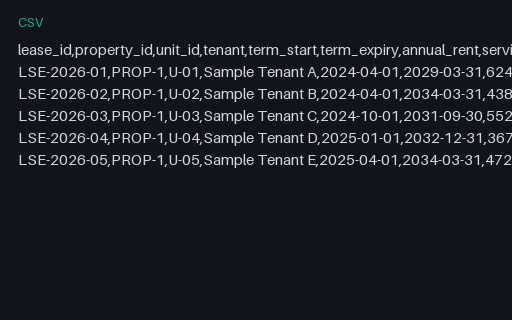
Lease register for Pine Property Services. The 5 live leases with days to expiry measured from the 2026-09-08 snapshot. The shortest has 935 days to run and the longest 2761. Service charge percentages here are the same apportionment the budget and reconciliation use, so the register can be joined to either.
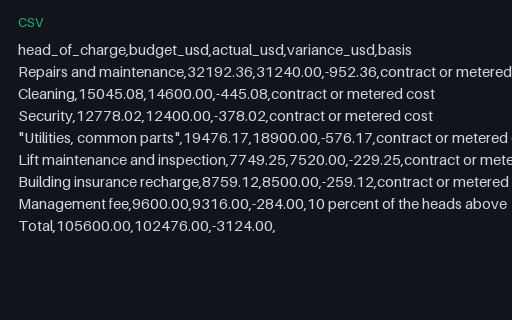
Service charge expenditure against budget for Pine Property Services. 6 heads of charge plus a management fee and a total. Actual expenditure is 102,476.00 USD against a budget of 96,000.00, and the management fee on both sides is 10 percent of the heads above it rather than a fixed amount, so it moves with the expenditure it is charged on.
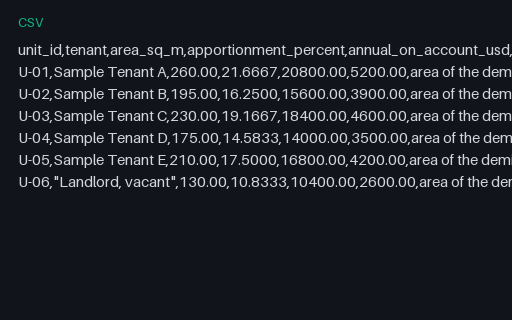
Service charge budget apportionment for Pine Property Services. The 96,000.00 USD budget apportioned across all six demises by area, including the vacant one, because a vacant unit share falls on the landlord and not on the other tenants. The six annual amounts sum to the budget exactly and the percentages sum to exactly 100.0000.
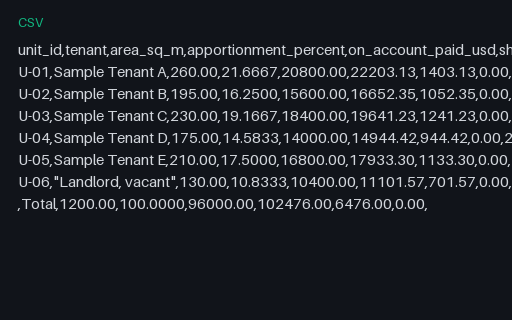
Service charge year end reconciliation for Pine Property Services. The year end settlement: each demise share of the 102,476.00 USD actually spent against the 96,000.00 USD paid on account, with the difference as a balancing charge. Every row share of actual less on account equals its balancing charge, and the charges sum to 6,476.00 USD, the overspend. No unit is in credit, so the credit column is 0.00 throughout and is kept as a column rather than dropped.
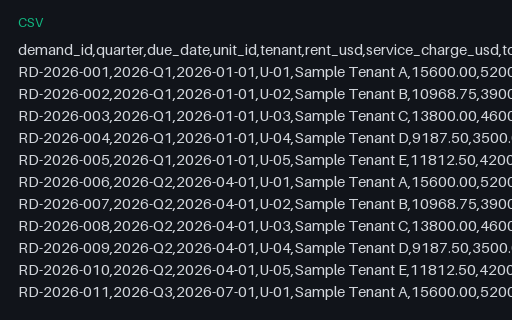
Quarterly rent and service charge demands for Pine Property Services. 20 demands across four quarters for the five let demises. Each total is rent plus service charge and each outstanding is total less paid. Demanded rent and service charge across the year come to 331,075.00 USD, and 98,781.25 is outstanding: one genuine arrear and 5 demands for a quarter that has not started at the 2026-09-08 snapshot.
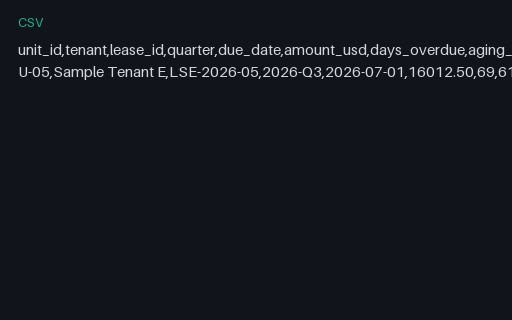
Arrears report for Pine Property Services. The one genuine arrear: U-05 owes 16012.50 USD for 2026-Q3, due 2026-07-01 and 69 days overdue at the 2026-09-08 snapshot, which puts it in the 61 to 90 day bucket. The 5 fourth-quarter demands are deliberately absent because a demand for a quarter that has not started is not an arrear.
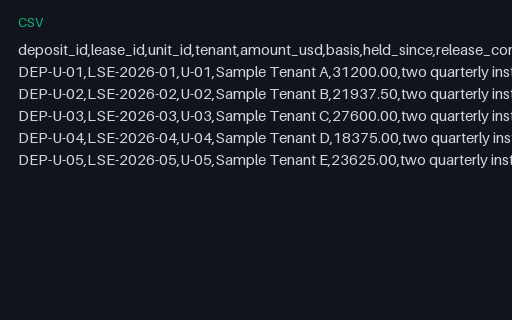
Deposit register for Pine Property Services. The 5 deposits, each two quarterly instalments of the rent on its own lease, holding 122,737.50 USD in total. Every deposit is released on expiry subject to a dilapidations claim, which is what connects this register to the dilapidations schedule in the same directory.
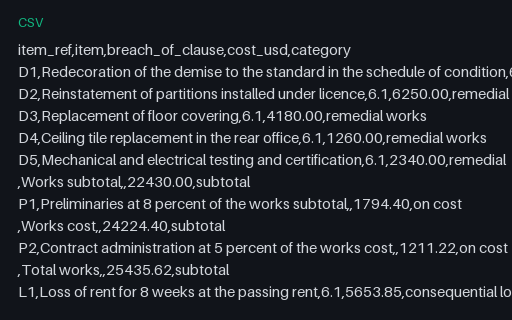
Schedule of dilapidations lines for Pine Property Services. The same 12 lines as data, with subtotal and total rows carrying an empty item_ref so they can be told apart from costed items. Only the 5 rows with a reference beginning D are remedial works; the rest are on costs, subtotals or the consequential loss.
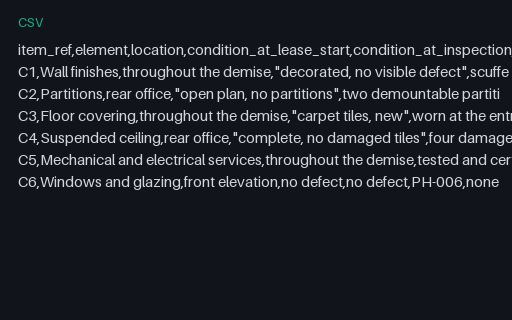
Schedule of condition for Pine Property Services. The 6 elements recorded at lease start and again at the exit inspection, with the dilapidations item each defect leads to. Five of the six lead to a costed item and the sixth records no defect and no action, so the schedule proves the claim is complete rather than only that it is arithmetically right.
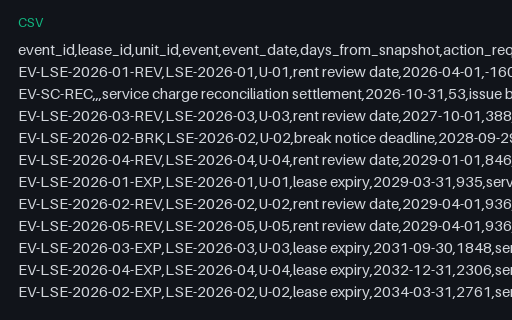
Lease events diary for Pine Property Services. 12 dated events in ascending order with days measured from the 2026-09-08 snapshot. 1 of them are already in the past and carry a negative number, because a rent review date that has passed is still a fact about the lease and dropping it would hide a review that was never actioned.
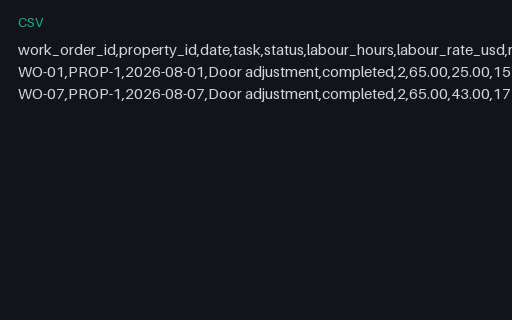
Building works recharged to the service charge for Pine Property Services. The 2 work orders the trades-property model records against PROP-1, with their labour and material costs, totalling 328.00 USD. All of them are recharged to the repairs and maintenance head, which is budgeted at 32,192.36 USD and spent at 31,240.00, so these rows are a subset of that head rather than the whole of it.
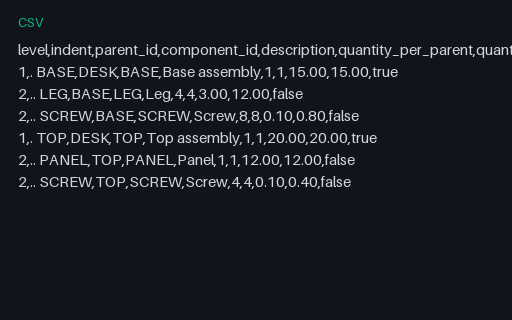
Indented bill of materials for Pine Assembly Workshop. The DESK structure exploded to 2 levels in 6 rows, with an indent column so the tree is readable and an is_assembly flag so leaves can be told from sub-assemblies. Per finished unit the leaves are 4 LEG, 1 PANEL and 12 SCREW, which cost 25.20 USD. The 35.00 USD of sub-assembly rows is the same material counted again at a higher level and must not be added to it.
Bill of materials exploded for a production order for Pine Assembly Workshop. The same structure exploded for BUILD-1, an order for 2 DESK. Extended quantity is quantity per parent times parent quantity on every row, and the leaf totals of 8 LEG, 2 PANEL and 24 SCREW equal the material requirements the inventory-manufacturing model already holds for that order, which the model_requirement column repeats on each leaf row for comparison.
Exploded bill of materials whose sub-assembly quantities do not roll up for Pine Assembly Workshop. The same 6 rows with one number changed: the SCREW line under BASE carries an extended quantity of 12 instead of 16. That row now says 8 per parent times 2 parents is 12, which is arithmetically false, and the SCREW leaf total falls to 20 against the 24 the model_requirement_component_total column on the same rows still declares. The shortfall is 4 screws, 0.40 USD of material, and it is enough to leave one BASE sub-assembly short at build time.
Standard cost roll-up for Pine Assembly Workshop. Every part with its material cost from the level below, the added value on top and the standard cost the parts table holds. On every row material plus added value equals standard cost. The DESK row takes its material from the two sub-assemblies at their standard costs, 35.00 USD, not from the leaves; the leaves come to 25.20 USD, and the difference is the added value already absorbed into the sub-assemblies.
Work order routing for Pine Assembly Workshop. The 5 operations for BUILD-1, each with a setup time charged once per order and a run time charged per unit. At an order quantity of 2 the total is 10 setup minutes plus 20 run minutes, 30 in all, which at 37.00 USD an hour is 18.50 USD of labour. Treating setup as a per-unit time instead would give 40 minutes and 24.67 USD.
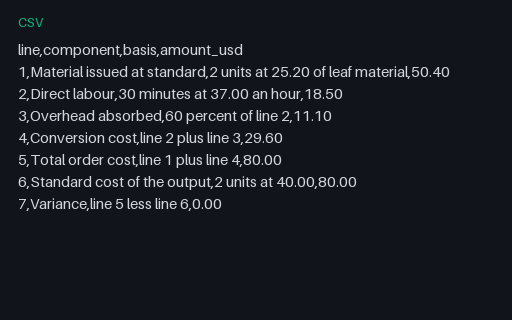
Work order cost build-up for Pine Assembly Workshop. The seven line cost of BUILD-1: 50.40 USD of material, 18.50 of labour and 11.10 of absorbed overhead, giving 80.00 USD against a standard cost of 80.00 USD for the output and a variance of 0.00. The order closes exactly to standard, which is deliberate: it makes any variance a reader computes a defect in their arithmetic rather than a property of the fixture.
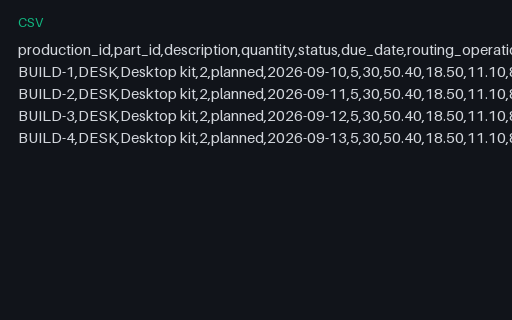
Work order register for Pine Assembly Workshop. The 4 production orders the model holds, all for 2 DESK each, costed through the same routing. Every order closes to standard with a zero variance because setup is the same and the quantity is the same on all four; a different order quantity would produce a variance, which is why the batch size is a column rather than an assumption.
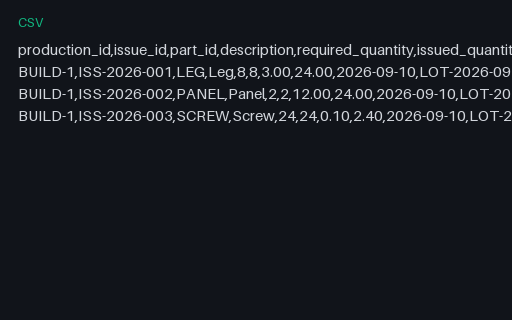
Material issue list for Pine Assembly Workshop. The 3 leaf components issued to BUILD-1, at the quantities the explosion reaches and the model requires. Issued value is 50.40 USD, which is exactly line 1 of work-order-cost.csv, so the issue list and the cost build-up close on each other. No sub-assembly appears, because BASE and TOP are made on this order rather than issued to it.
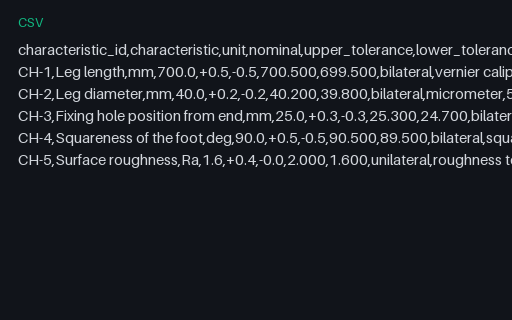
Inspection characteristics and tolerances for Pine Assembly Workshop. The 5 characteristics taken from DRW-LEG-002 revision C, with the nominal, both tolerances and the resulting limits. Four are bilateral and one, surface roughness, is unilateral with a lower tolerance of zero, so its lower limit equals its nominal and a reader that assumes symmetry computes a limit that does not exist.
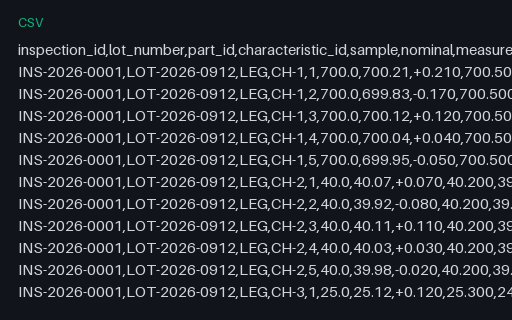
Inspection measurements with tolerances for Pine Assembly Workshop. 25 readings, 5 samples across 5 characteristics of the LEG part. Deviation is measured less nominal and carries an explicit sign, and result is pass only when the reading lies between both limits inclusive. 2 readings fail: CH-3 sample 3 measured 25.41, above the upper limit of 25.300 by 0.110; CH-5 sample 5 measured 1.58, below the lower limit of 1.600 by 0.020.
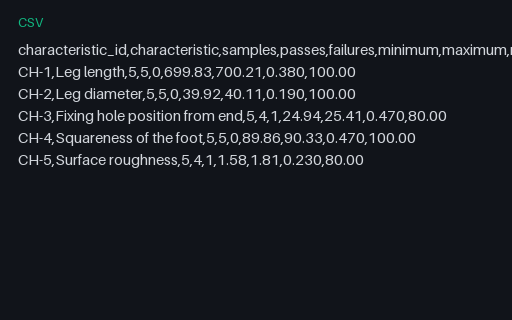
Inspection summary for Pine Assembly Workshop. One row per characteristic with the pass count, the observed minimum and maximum and the range. 3 characteristics pass every sample and 2 do not. The range column is observed spread and not tolerance, so a characteristic can have a small range and still fail if the whole sample sits off nominal.
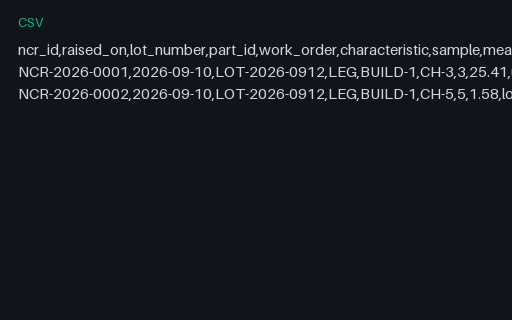
Nonconformance register for Pine Assembly Workshop. 2 nonconformances, one per failing reading, each naming the characteristic, the limit breached and the amount by which it is breached. Both are single legs, 6.00 USD of material in total, so the 80.00 USD work order is not materially affected and the closed_on column is empty because neither is closed at the snapshot.
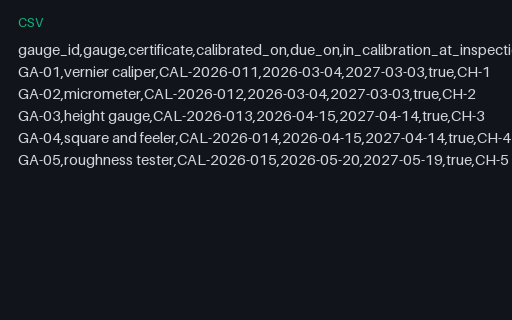
Gauge calibration register for Pine Assembly Workshop. The 5 gauges used on this inspection, each with its calibration certificate, the date it was calibrated and the date it falls due. All 5 were inside calibration on 2026-09-10, the inspection date, and the used_for column names the characteristics each one measured, so every characteristic can be traced to a gauge and every gauge to a certificate.
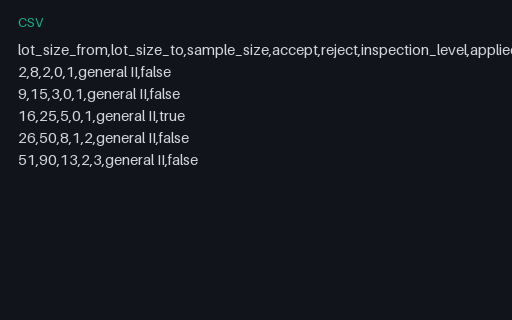
Attribute sampling plan for Pine Assembly Workshop. The sampling table the inspection used. The lot of 16 legs, being the quantity issued to BUILD-1 and BUILD-2 together, falls in the 16 to 25 band, which calls for a sample of 5 and an accept number of 0, and 5 is exactly the number of samples inspection-measurements.csv holds for each characteristic. With an accept number of 0 and 2 nonconforming readings, the lot is rejected on the plan and dealt with by nonconformance rather than by acceptance.
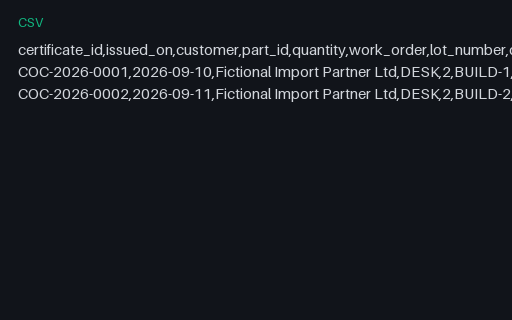
Certificate of conformance register for Pine Assembly Workshop. Two certificates against the same lot and the same inspection report, one per production order. The first discloses 2 nonconformances and the second none, because the nonconforming legs were consumed by the replacement on the first order and the second order drew clean stock from the same lot.
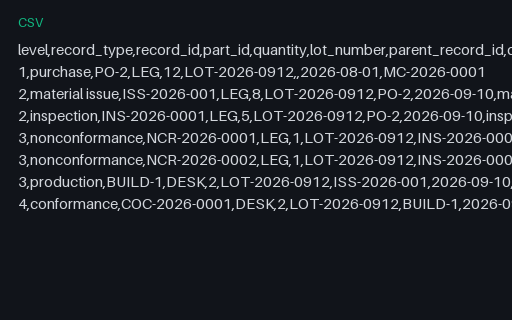
Lot genealogy for Pine Assembly Workshop. The chain from purchase to certificate for lot LOT-2026-0912 in 7 records, each naming its parent record and the file that evidences it. Every evidence value that names a file names one that exists in this directory, so the genealogy is walkable rather than decorative.
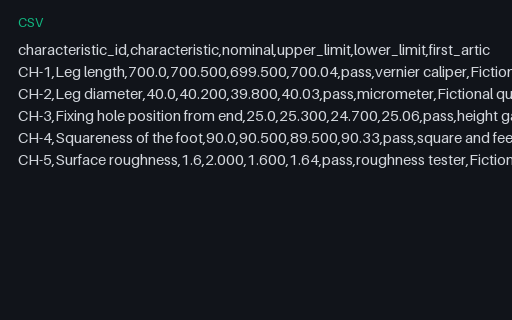
First article inspection for Pine Assembly Workshop. The first article record for LEG against DRW-LEG-002 revision C: all 5 characteristics measured and passed before the run started. The readings are the fourth sample from the production inspection, which is deliberate: the first article passes on every characteristic while the production lot later fails on two, so the pair shows that a clean first article does not guarantee a clean run.
Yield and scrap for Pine Assembly Workshop. Yield by production order. Every order yields 2 good units for 2 ordered, so finished-goods yield is 100.00 percent on all four, while BUILD-1 scrapped 2 legs worth 6.00 USD at component level. The two measures are in separate columns on purpose: component scrap that is replaced before assembly does not reduce finished-goods yield, and reporting one as the other is the mistake this file exists to catch.
CSV twin of the multi-currency SAMPLE invoice ledger.
CSV action-item export twin for the SAMPLE meeting notes.
CSV twin of the SAMPLE OKR sheet.
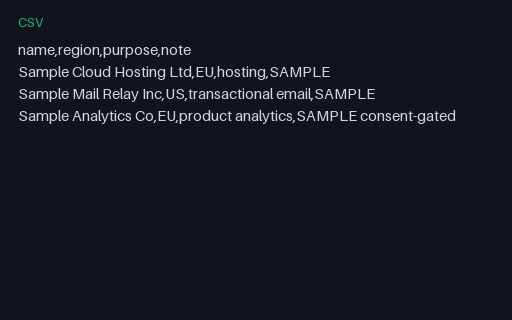
CSV Annex A twin listing fictional SAMPLE subprocessors for the deep DPA.
SAMPLE CSV export row for the employment form submission shape.
SAMPLE CSV export row for the housing form submission shape.
SAMPLE CSV export row for the nonprofit form submission shape.
SAMPLE CSV export row for the events form submission shape.
SAMPLE CSV export row for the finance form submission shape.

SAMPLE CSV export row for the education form submission shape.
SAMPLE CSV export row for the parking form submission shape.

SAMPLE CSV export row for the events form submission shape.
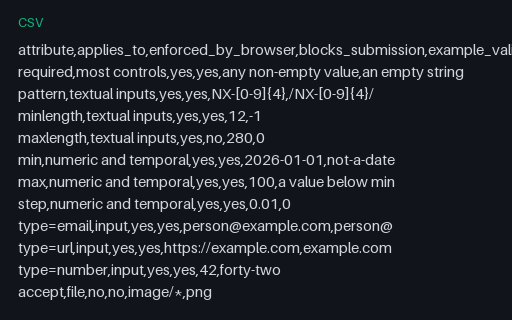
A flat table of the HTML5 constraint attributes: what each applies to, whether the browser enforces it, whether it blocks submission, and one valid and one invalid example. The spreadsheet-shaped twin of the JSON constraint rules.
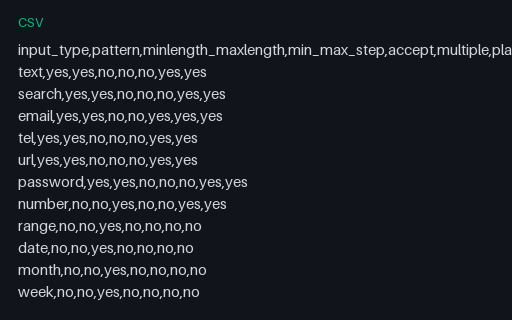
Twenty input types crossed with the seven attributes that may or may not apply to them, so a form builder can be checked for attributes it emits on controls that ignore them.
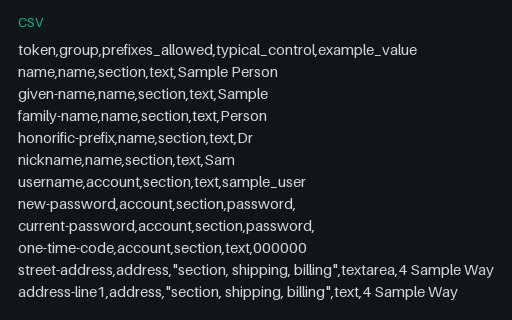
The autofill tokens as a flat table with their group, the prefixes each accepts, the control type they usually sit on and a sample value. Useful for driving a data-driven autofill test.
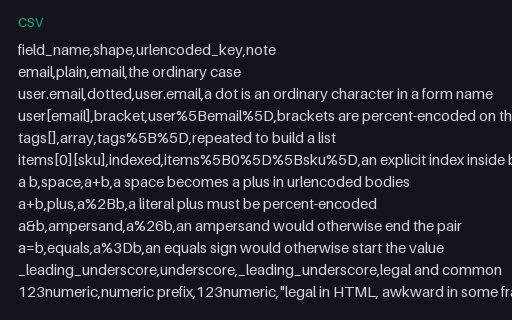
Fifteen awkward field names with the urlencoded key each produces: brackets, array notation, spaces, plus signs, ampersands, equals signs and three non-ASCII scripts including an astral emoji.
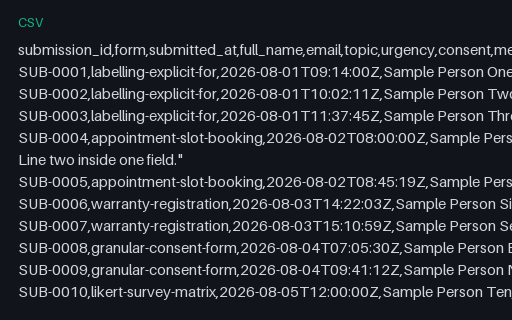
Twelve fictional submissions in one export, including values with commas, embedded quotation marks, an embedded newline, an empty cell and non-ASCII text. Sized for testing an importer rather than a database.
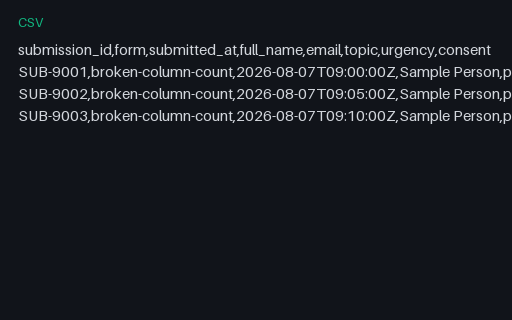
Intentionally corrupt. A submissions export whose header declares eight columns while its three data rows carry six, ten and eight, so a reader has to choose between padding, truncating and refusing.
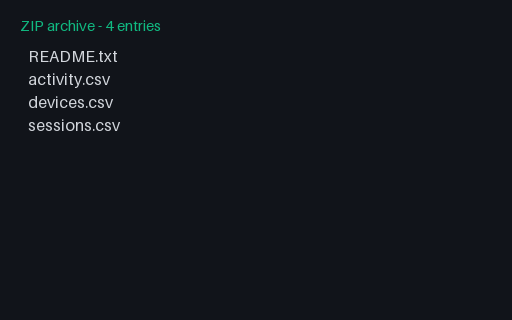
SAMPLE GDPR-style ZIP dominated by activity/devices/sessions CSVs: fictional PII.
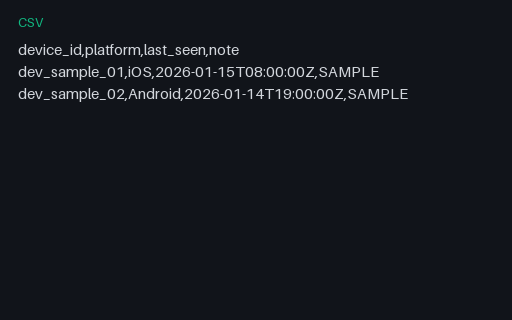
SAMPLE devices CSV twin for privacy-export tooling.
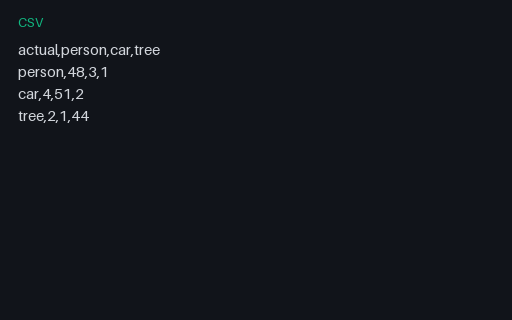
A 3-class confusion matrix as CSV: rows are the true class, columns the predicted class, cells the counts. Paired with a JSON twin for testing metric parsers and evaluation visualisers.
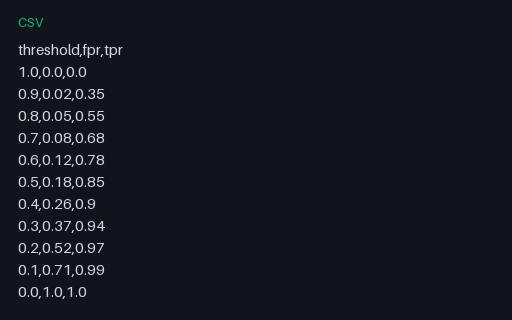
An ROC curve as CSV: decision threshold with the corresponding false-positive and true-positive rates, monotonic from (0,0) to (1,1). A fixture for testing chart tools and AUC calculators.
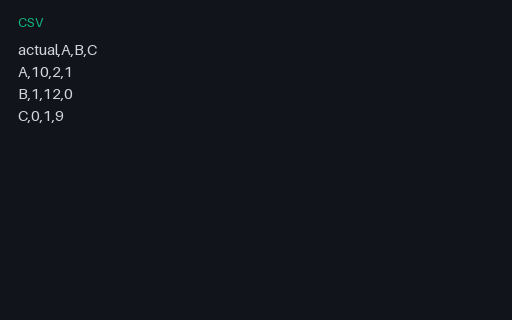
3×3 confusion matrix CSV for classification metric calculators.
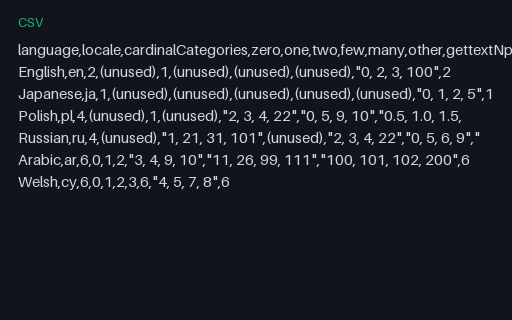
One row per language, one column per CLDR plural category, filled with the smallest integers that select it: the sheet to hand a translator or a PM when explaining why 'one' and 'other' is not enough. Japanese needs one form and Welsh needs six.
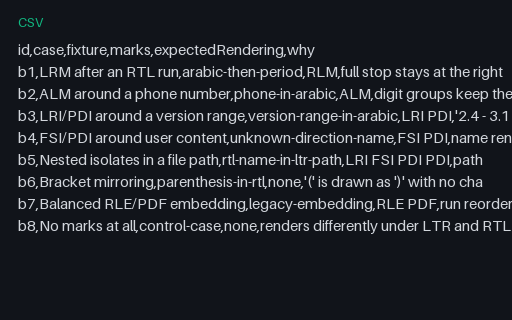
A flat index of the bidi cases in this wave, which mark each one uses, what it should render as, and why the neutral characters involved need help. Row b8 is the control case with no marks, against which the other seven are compared.
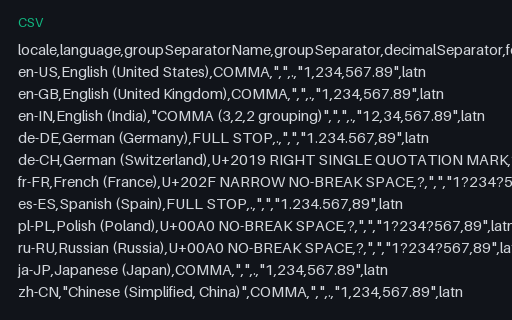
The same number, 1234567.89, rendered for twelve locales, with the group and decimal separator that produced each one named by code point and present literally in the cell. Four of the separators are not ASCII (U+00A0, U+202F, U+2019 and U+066C), and ar-EG additionally switches the digits themselves.
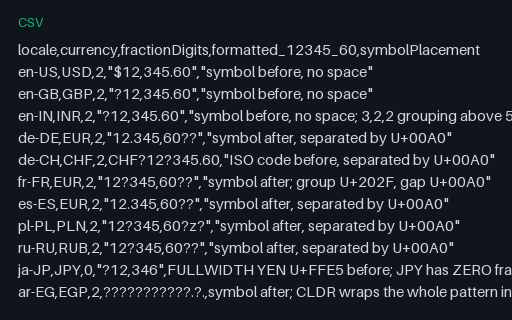
12345.60 in each locale's own currency, with the fraction-digit count and the symbol placement that produced it. JPY takes zero decimals and rounds; six rows separate the amount from the symbol with U+00A0 rather than a plain space; and ar-EG puts the amount in Arabic-Indic digits.
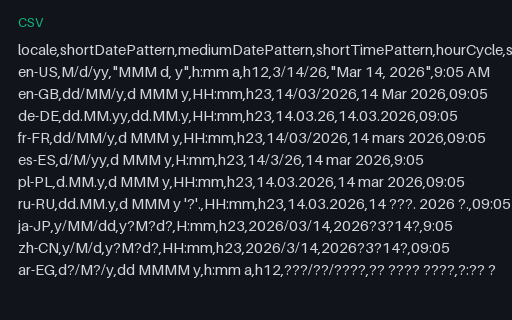
Short and medium date patterns, the short time pattern and the hour cycle for ten locales, each with the rendering of 2026-03-14T09:05. The ar-EG patterns contain U+200F between their fields and ru-RU's medium pattern ends in a quoted literal, so neither is the plain ASCII it appears to be.
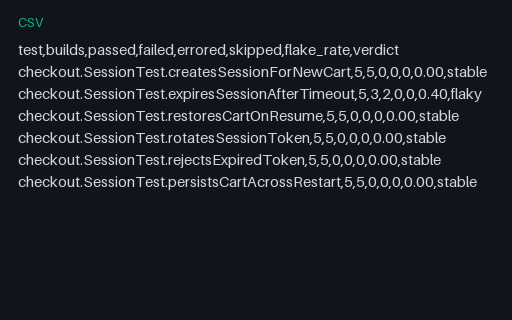
The answer key for the timing race family: the flake rate a detector should derive from the five build reports next to it. Exactly one of the six tests is unstable, at a rate of 2/5; the other five are stable at 0.00.
The answer key for the order dependent family: the flake rate a detector should derive from the five build reports next to it. Exactly one of the six tests is unstable, at a rate of 2/5; the other five are stable at 0.00.
The answer key for the network dependency family: the flake rate a detector should derive from the five build reports next to it. Exactly one of the six tests is unstable, at a rate of 2/5; the other five are stable at 0.00.
The answer key for the quarantined after two failures family: the flake rate a detector should derive from the five build reports next to it. Exactly one of the six tests is unstable, at a rate of 5/5; the other five are stable at 0.00.
The aggregate answer key for the 40-build history in this group: runs, passes, failures and failure rate per test, with each test labelled stable or flaky. Use it to score a detector rather than eyeballing 240 JSONL records.
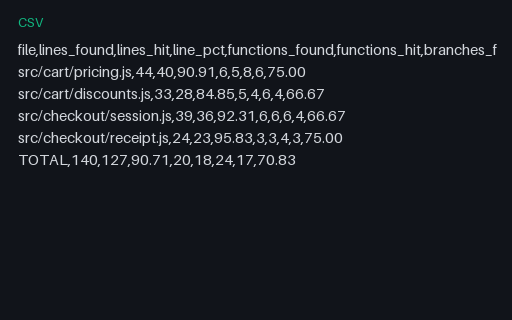
The same coverage as a flat table with a TOTAL row, for spreadsheets, trend charts and diffing two runs without an XML parser. The TOTAL row is the arithmetic sum of the four file rows, so it doubles as a checksum on any tool that regenerates it. Every file in this group describes the same four-file source tree and reports 127/140 lines, 17/24 branch outcomes and 18/20 functions, so a converter can be diffed against a known answer.
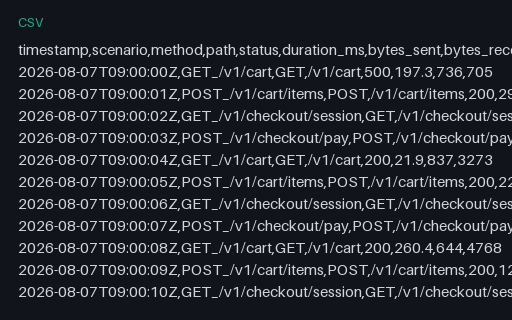
Three hundred individual request records with timestamp, scenario, status and duration: the raw log a percentile calculation has to be computed from rather than read off. A handful of 4xx and 5xx responses are mixed in so an error-rate calculation has something to find.
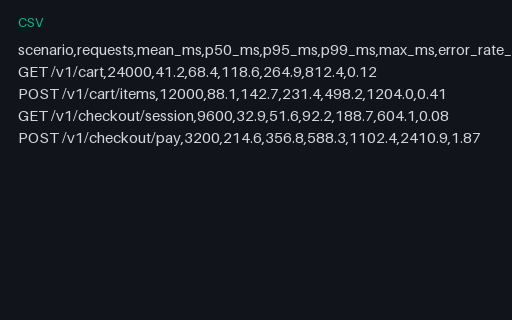
The percentile table a performance report renders as a chart, with mean, p50, p95, p99 and max for each of the four scenarios. The same numbers appear inside the JSON summary in this group, so a chart built from either source can be diffed against the other.
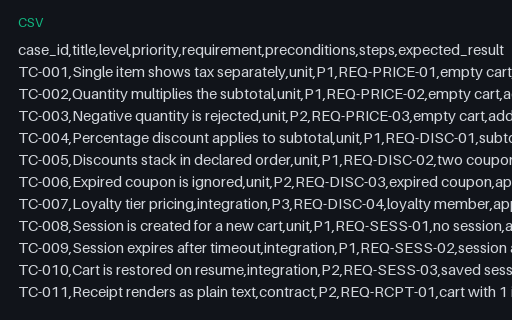
Twelve test cases with level, priority, the requirement each covers, preconditions, steps and expected result: the table a test-management import expects. Eleven of the twelve are automated, and the requirement column joins this file to the traceability matrix next to it.
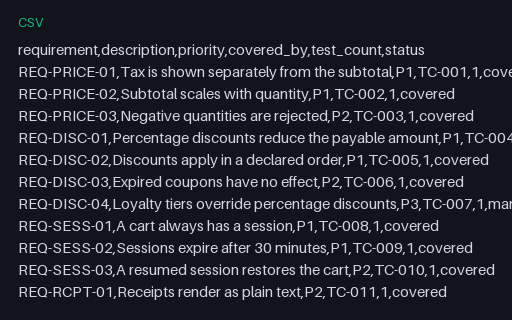
Thirteen requirements mapped to the test cases that cover them, and one, REQ-PAY-02, deliberately covered by nothing. A coverage-gap report that does not surface that row is not working, which makes this the answer key for exactly that check.
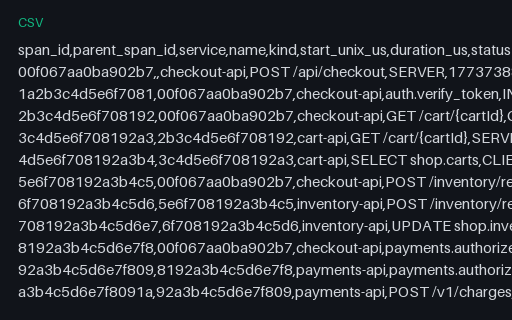
The same 13 spans flattened to a CSV table: span and parent IDs, service, name, kind, start timestamp, duration and status. The shape a trace store exports for spreadsheet analysis, and a readable ground truth to diff the three JSON twins against.
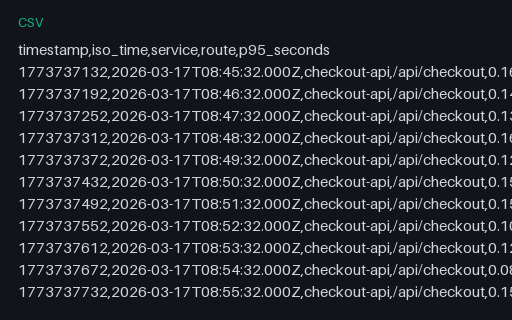
The same 90 samples as the query_range response, exported one row per observation with both epoch and ISO 8601 timestamps. The long layout every dataframe library prefers, and half of a reshaping pair.
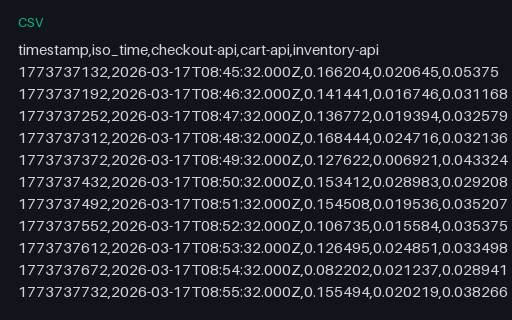
The same 90 samples pivoted to one column per service and one row per timestamp: the layout a spreadsheet chart expects. Paired with the long-format export so a reshape can be scored in both directions.
A day-by-day burndown of the availability SLO defined in the OpenSLO fixture: achieved ratio, budget consumed and remaining, and one-hour and six-hour burn rates. Consumption is monotonic across the window, which is the invariant a burn-rate chart must not violate.
The same fictional component tree flattened to a spreadsheet-friendly CSV (name, version, licence, depth, purl and a SHA-256 prefix) for testing the export path SBOM tools offer alongside JSON. Every package, version, hash and licence is fictional: the tree describes nothing real.
Declared range against resolved version for every fictional package pinned by the lockfiles in this category: the table a review needs to see which pins drifted from their manifest ranges. Every package, version, hash and licence is fictional: the tree describes nothing real.
The four SAMPLE advisories flattened to one row each: the export a security review circulates, and the reference answer for any converter run against the Trivy, Grype or OSV reports here. Advisory identifiers use the invented NOVUS-SAMPLE namespace with SAMPLE-CVE aliases; no identifier here refers to a published CVE, GHSA or OSV record, and no package named exists.
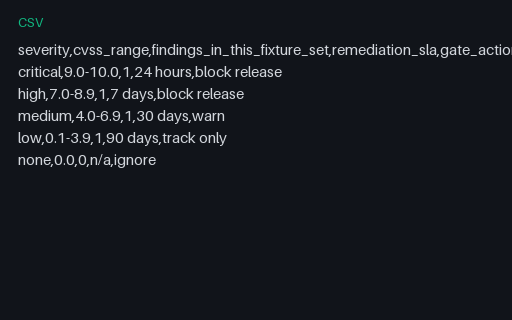
A severity-band table mapping CVSS ranges to remediation SLAs and gate actions, with the finding count each band has in this fixture set, so a policy engine can be tested end to end. Advisory identifiers use the invented NOVUS-SAMPLE namespace with SAMPLE-CVE aliases; no identifier here refers to a published CVE, GHSA or OSV record, and no package named exists.
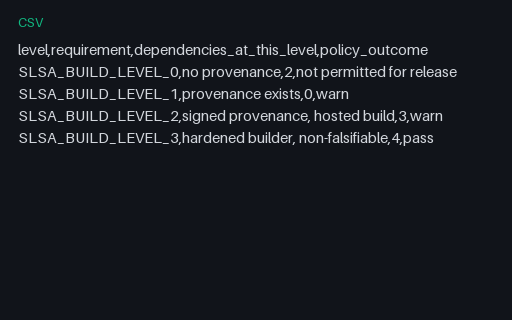
How the nine fictional dependencies distribute across SLSA build levels, with the policy outcome for each band: the table that turns the VSA's dependencyLevels object into something reviewable. Every package, version, hash and licence is fictional: the tree describes nothing real.
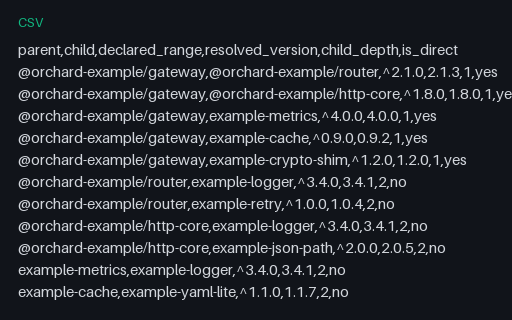
Every edge in the fictional dependency graph as one row (parent, child, declared range, resolved version, depth and whether the edge is direct), the form a spreadsheet or SQL import can aggregate. Every package, version, hash and licence is fictional: the tree describes nothing real.
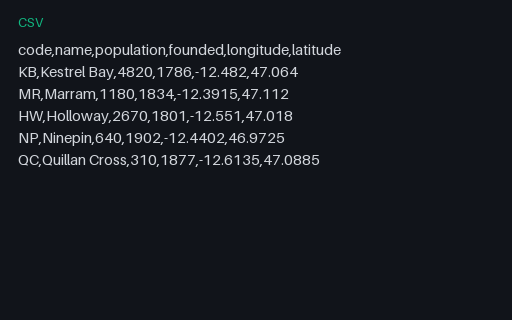
The five towns as a plain CSV with separate longitude and latitude columns: the most common way point data actually arrives. Convert it to GeoJSON and diff against the Point features in the master to score column-order and axis-order handling.
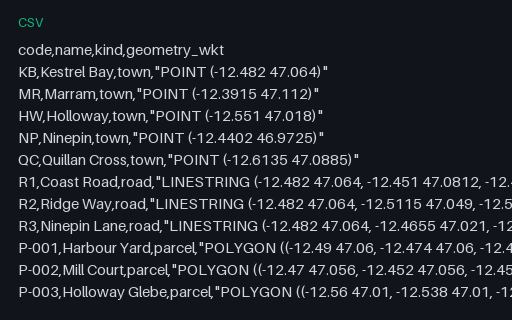
Attributes plus a quoted WKT geometry column: the shape PostGIS `COPY`, DuckDB spatial and QGIS delimited-text imports expect. The geometry field contains commas, so it exercises quoted-field parsing as well as geometry decoding.
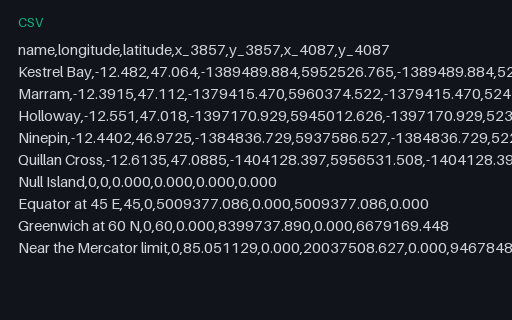
Nine control points (the five towns plus Null Island, the equator, a high-latitude point and the Web Mercator latitude limit) with their coordinates in both projections. The two target projections share the x formula and differ only in y, which isolates a latitude-transform bug from a longitude one.
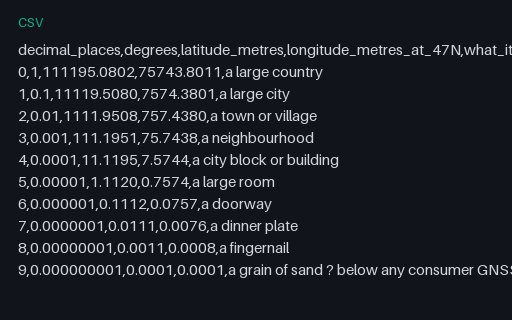
What each decimal place is actually worth on the ground, computed on a sphere of mean Earth radius at the territory's latitude. Longitude degrees are shorter than latitude degrees by the cosine of the latitude, which is why the two columns diverge.
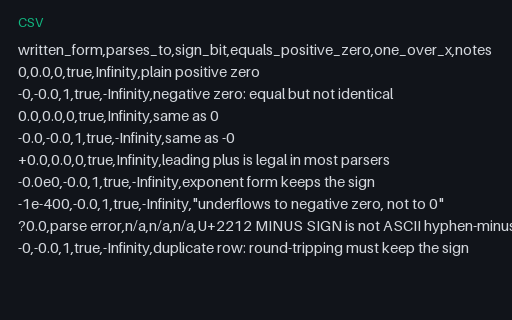
Nine ways of writing zero, what each parses to, and what dividing one by the result gives. Negative zero compares equal to positive zero yet behaves differently in division and in sign propagation, so a formatter that drops the sign changes results without changing any comparison.
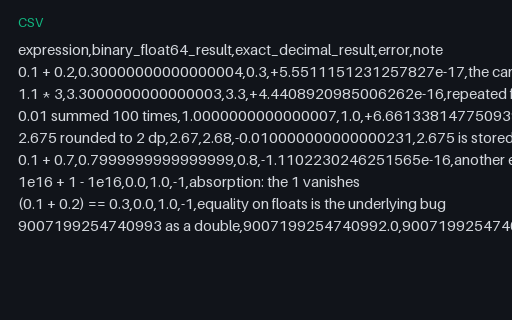
Eight arithmetic expressions where binary floating point and exact decimal disagree, with both answers and the signed error side by side. Adding one cent a hundred times does not give one, and this file says by exactly how much.
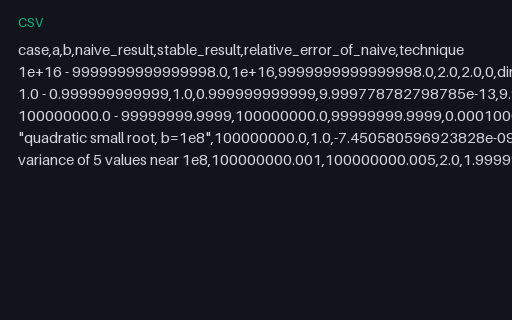
Five computations done twice, once with the obvious formula and once with the numerically stable one, with the relative error of the naive version alongside. The one-pass variance row is the memorable one: five values a millisecond apart near 1e8 can produce a negative variance.
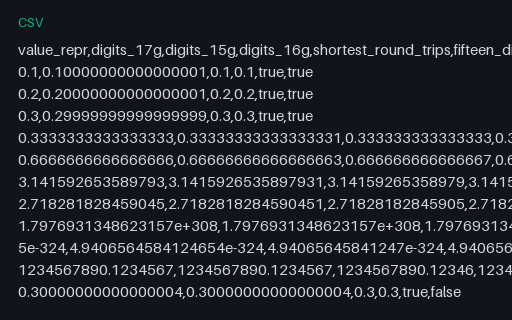
Twelve doubles printed at 15, 16 and 17 significant digits alongside their shortest round-tripping form, with a column recording which precisions actually recover the original bits. Fifteen digits is the default in a lot of formatting code and it loses values, which this table demonstrates rather than asserts.
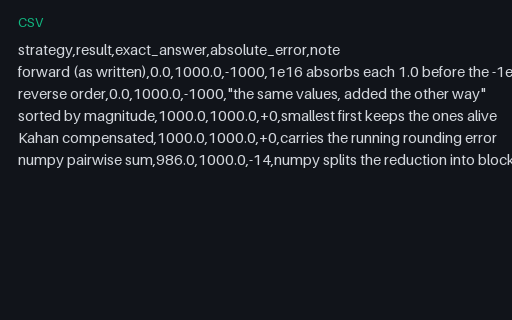
The same 1002 numbers added five different ways, giving results from 0 to 1000 for an exact answer of 1000. Floating-point addition is not associative, and this file is the smallest complete demonstration of what that costs a naive accumulator.
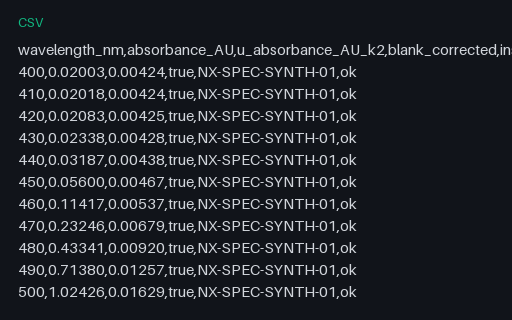
A synthetic absorbance scan from 400 to 630 nm with a Gaussian band at 520 nm, carrying its expanded uncertainty at k=2 in a dedicated column and a per-row quality flag. The unit and the coverage factor live in the column names, which is the convention most instrument exports actually use.
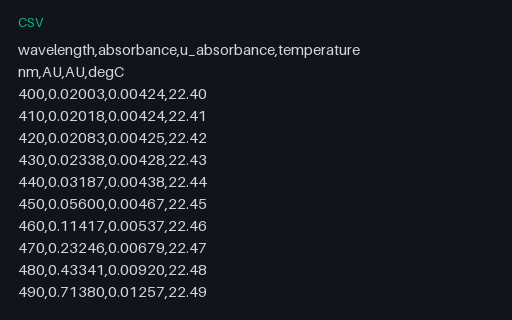
The same instrument export with units on a second header row instead of inside the column names, which is how a great many laboratory instruments write CSV. An importer that treats row two as data types every measurement column as text and then quietly refuses to plot anything.
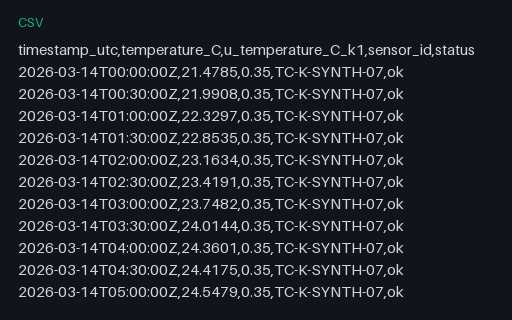
A full day of thermocouple readings at 30-minute cadence with a constant type-B standard uncertainty and two rows flagged as recovering. The timestamps are explicit UTC with a Z suffix so a reader has no excuse to guess a timezone.
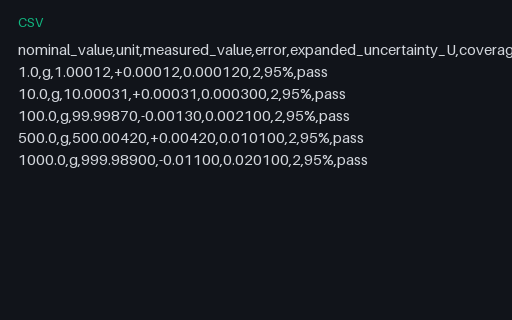
Five calibration points with the nominal value, the measured value, the signed error and the expanded uncertainty at k=2 with its confidence level stated. It is a synthetic illustration of the layout, not an accredited certificate, and nothing in it refers to a real instrument or laboratory.
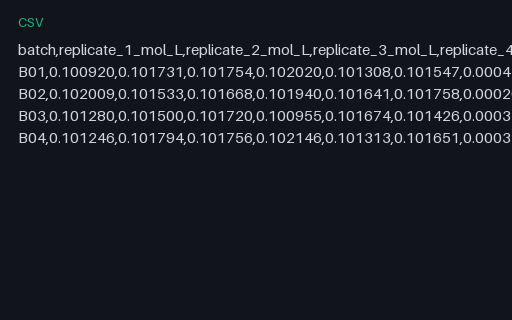
Four batches of five replicate titrations with the mean, sample standard deviation, standard error and relative standard deviation computed for each. The standard deviation uses the n-1 denominator, which is stated explicitly because a population-denominator implementation disagrees on every row.
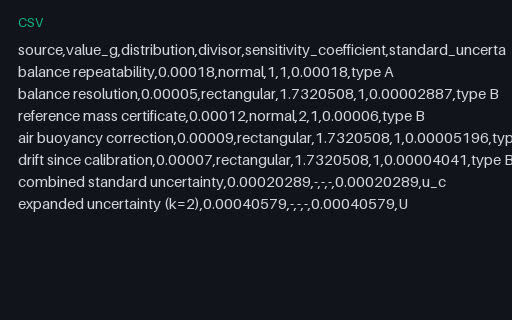
A five-source uncertainty budget laid out the way the GUM prescribes: each source with its distribution, its divisor, its sensitivity coefficient and its contribution, then the combined and expanded values. Rectangular sources are divided by the square root of three, which is the step budget spreadsheets most often get wrong.
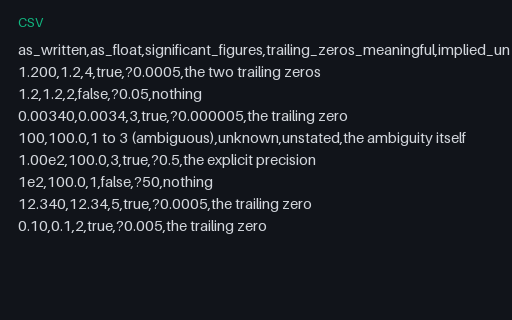
Eight written measurements where the trailing zeros carry the precision of the measurement, alongside what a float parse leaves behind. Parsing 1.200 to the double 1.2 is not a rounding error, it is the loss of the claim that the value is known to four figures.
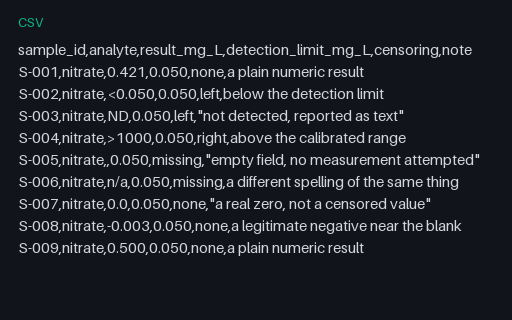
Nine laboratory results where only four are plain numbers: two are below the detection limit, one is above range, two are missing in different spellings, and one is a legitimate small negative near the blank. Coercing the censored strings to numbers or to NaN both bias the summary, and the file distinguishes every case explicitly.
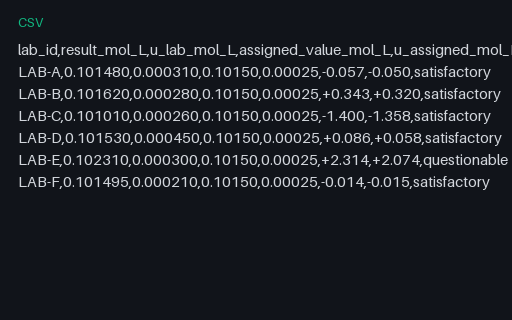
Six fictional laboratories reporting the same measurand, scored both by z-score against a fixed sigma and by En number against each lab's own claimed uncertainty. The two statistics disagree about which labs are acceptable, which is the point: En rewards an honest uncertainty claim and z does not.
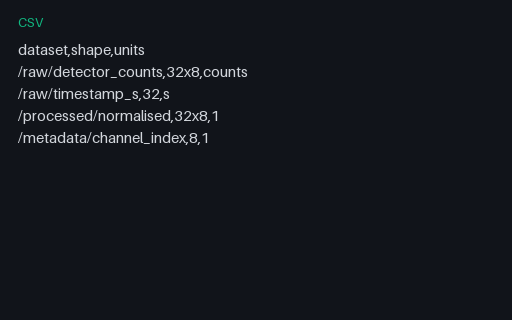
CSV reference listing the four expected HDF5 datasets with shapes and units for lightweight converter assertions. Stable P8 artifact p8-convert-hdf5-summary-csv.